I wanted to get a feel for how fast my AMD Radeon RX 6600 could transfer memory around and how much this changed depending on how much memory was being transferred as well as what type of memory was being copied to and from (E.g. UPLOAD or READBACK). I will also compare the results to a much more powerful NVIDIA RTX 5080.
My test setup is fairly simple, and with very little overhead. It’s a simple DirectX 12 application which simply issues ID3D12GraphicsCommandList::CopyResource commands from one allocated resource to another. The advantage of using CopyResource is that it allows the driver to decide how best to optimise the copy for the hardware. An alternate approach would be to write and issue compute shaders myself to transfer the data. We observed on AMD hardware with the Radeon GPU Profiler that the driver is issuing dispatch calls when we make calls to CopyResource and I’d expect the Nvidia card to be doing the same.
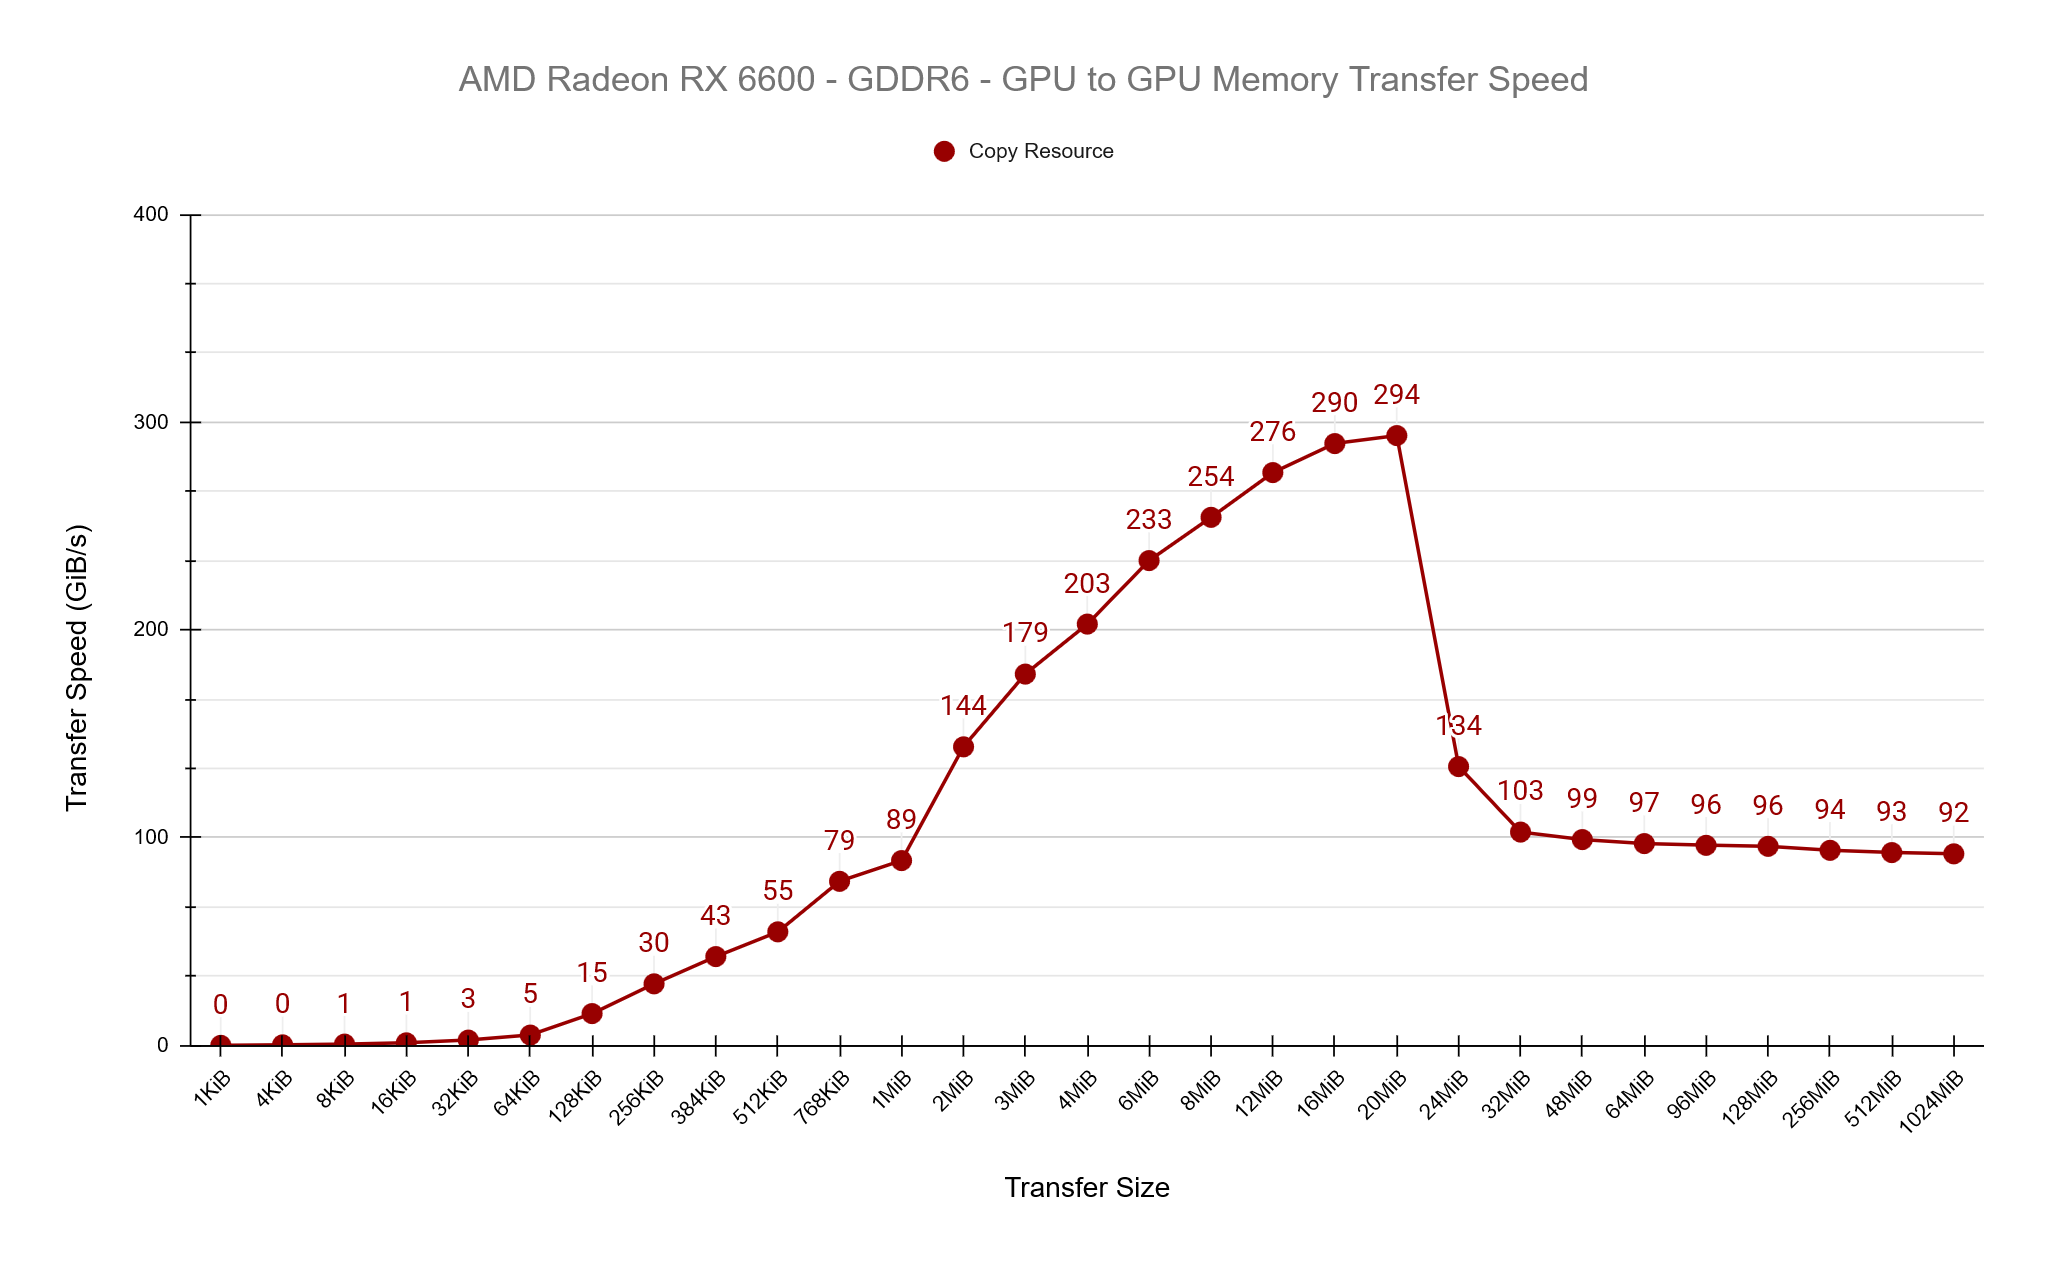
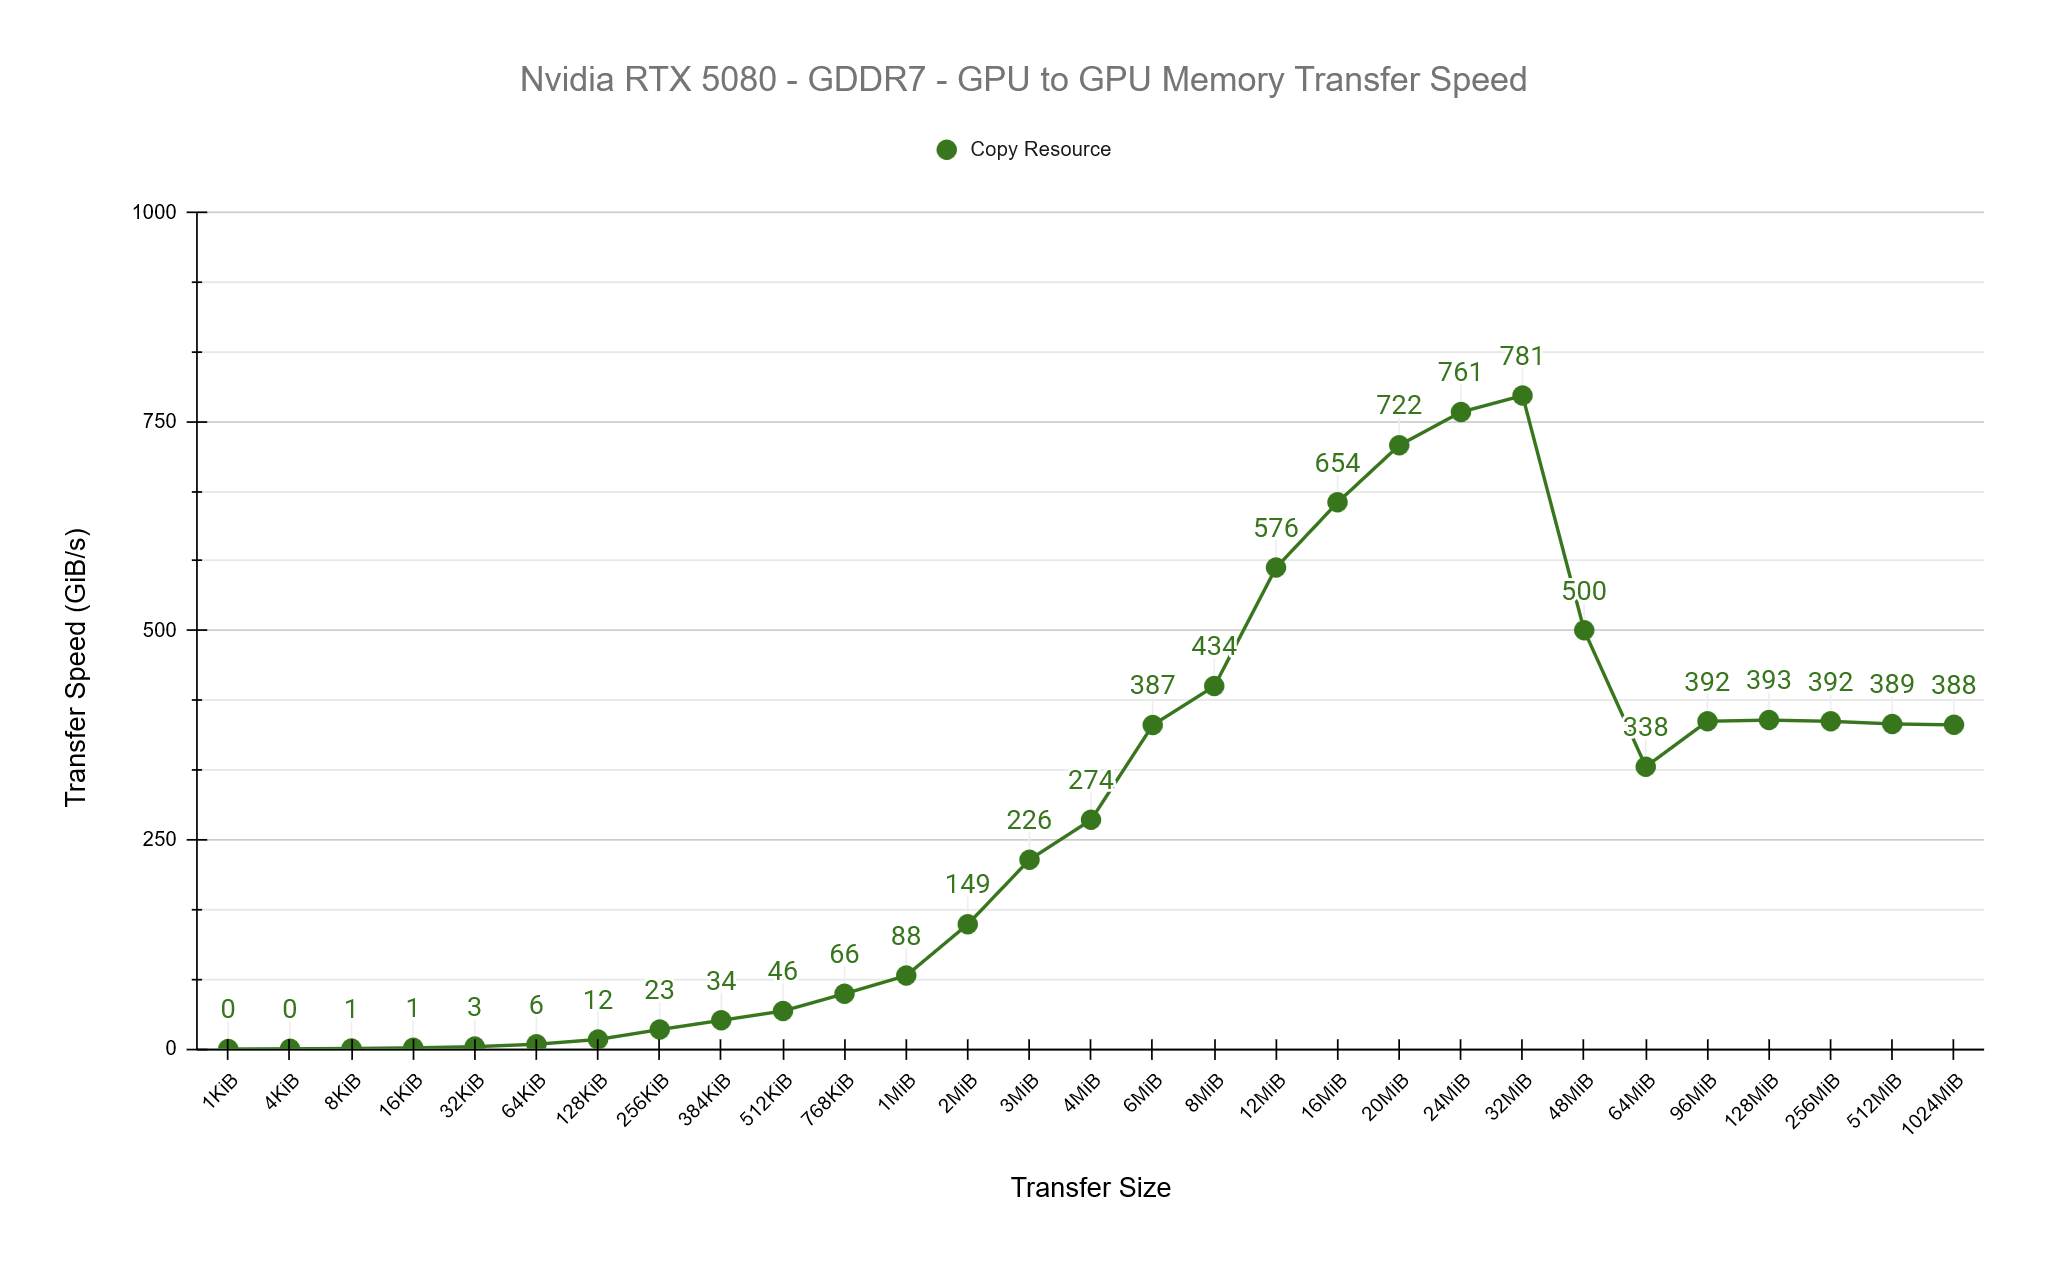
See the results of the tests below. Both GPUs show a similar pattern of increasing transfer rates until a point, then dropping and stabalising. I believe what we’re seeing here is the impact of the cache sizes on both GPUs, which is 32MiB for the RX 6600 and 64MiB for the RTX 5080. We observe peak transfer speeds on both cards at roughly 50% of the cache size before dropping off and stabilising.
PCIe Transfer Speeds
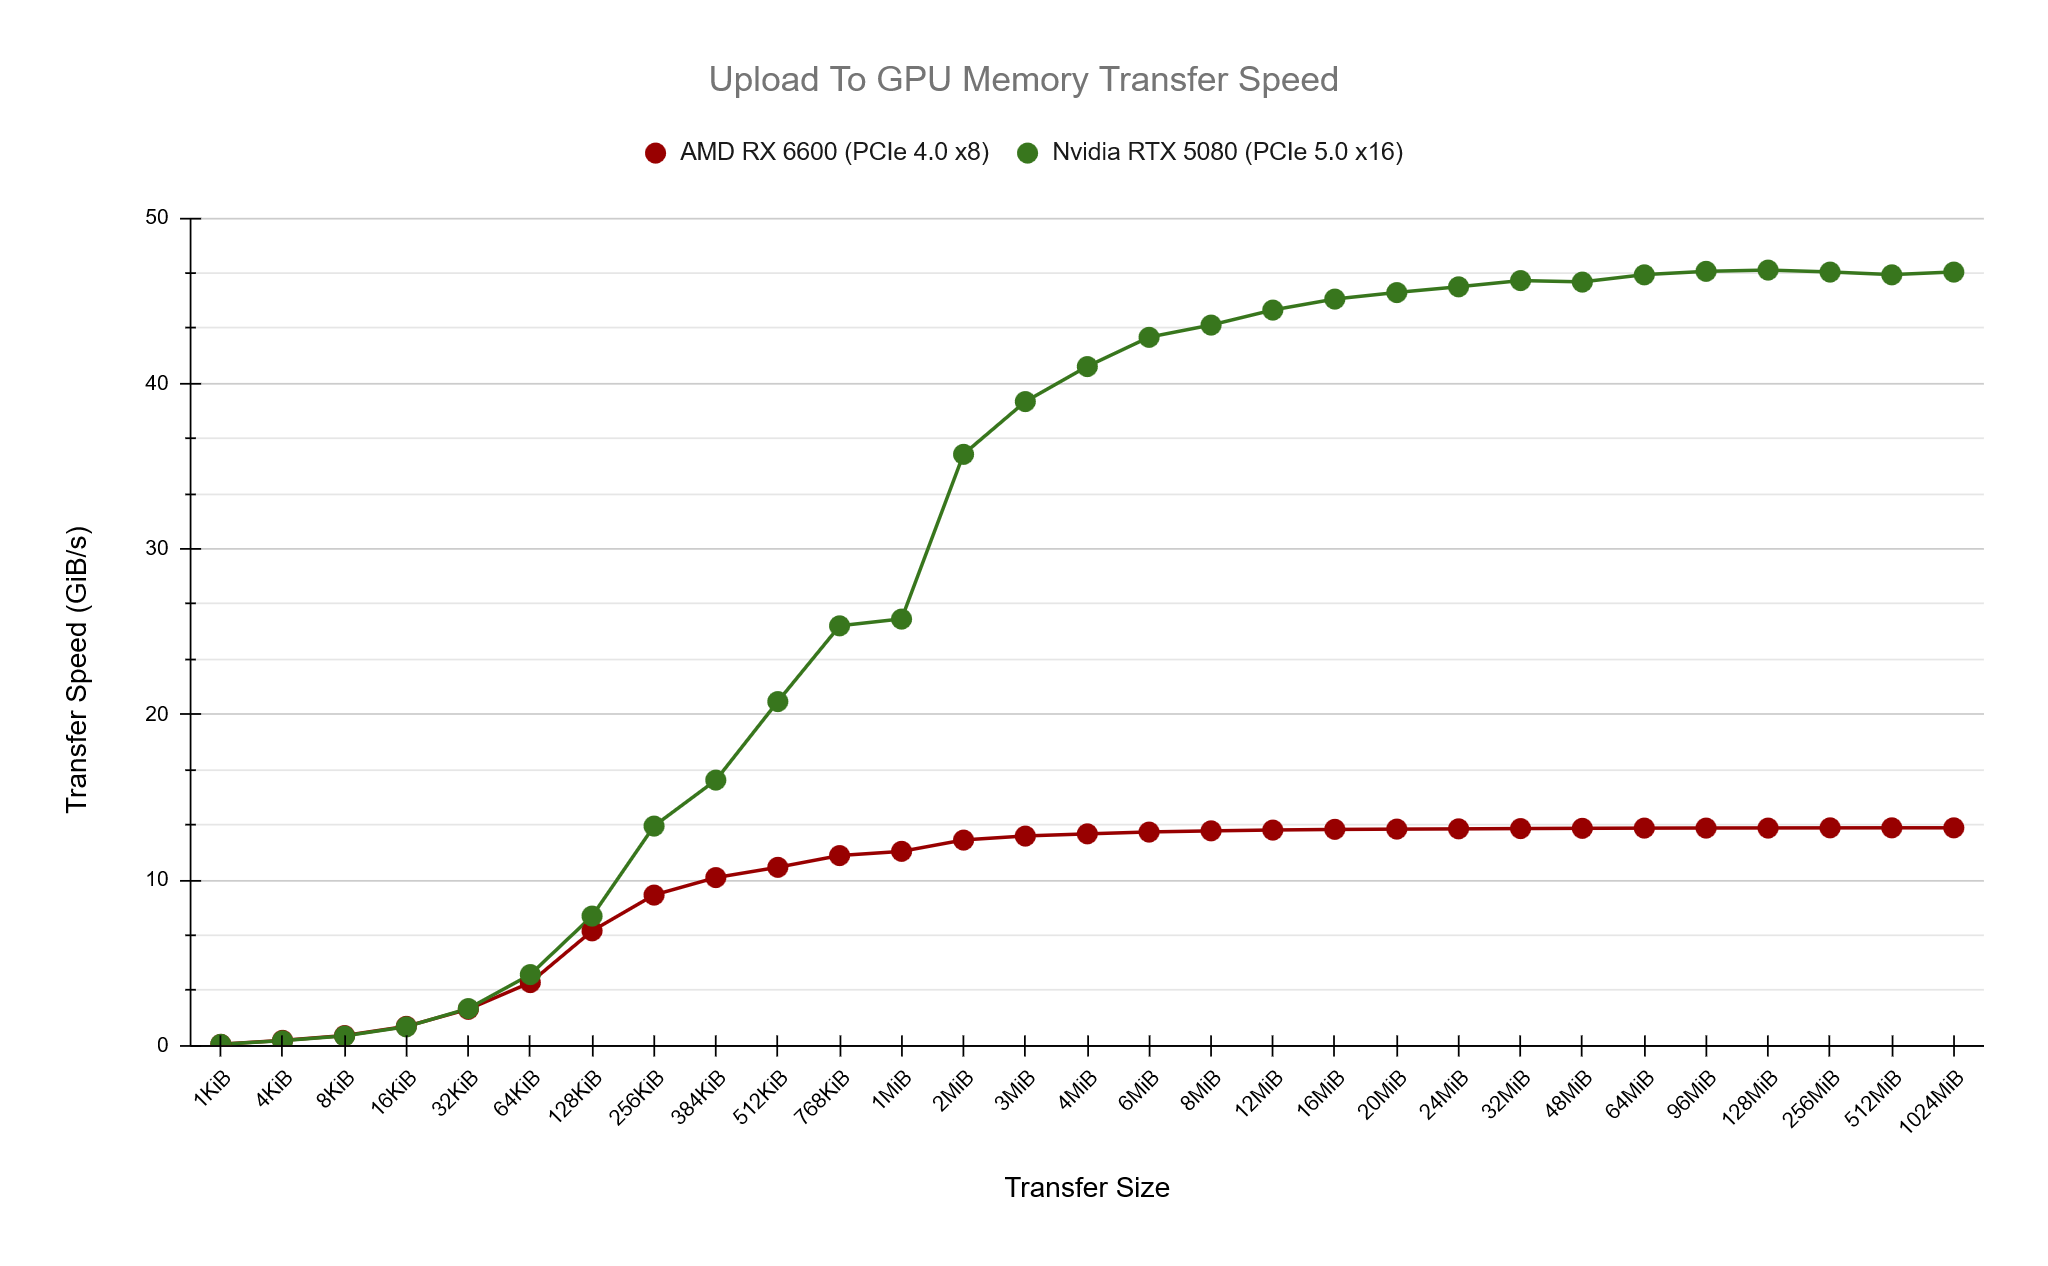
Next up, how does transfer speed from UPLOAD memory to on-chip GPU memory compare? In these tests we know that transfer speeds will be occuring over the PCIe bus and naturally we’re expecting slower transfer speeds when compared to on-chip GPU to GPU copies. The AMD card is using PCIe x8 4.0 which has a maximum listed speed of 15.754GiB/s while the NVIDIA at PCIe x16 5.0 with 63.015 GiB/s. (https://en.wikipedia.org/wiki/PCI_Express)
In my test results the AMD card peaks at around 13.2 GiB/s while the Nvidia card around 47 GiB/s, close but not quite reaching the maximum listed speeds. What I find interesting here is how we can get a feel for the optimal amount of memory to be transferring to achieve maximum speed, around 1-2MiB for the AMD card and 16-20MiB for the Nvidia.
A Peek Under The Hood
I mentioned previously that we’re using the CopyResource D3D12 function to copy resources from one location to another and this allows the driver to handle this however it wants. To take a peek under the hood, I’ve used AMD’s Radeon GPU Profiler tool while running tests of various speeds. I will focus on 4 different transfer sizes and dig in to them a little deeper. AMD’s tool confirms that under the hood, it’s using compute dispatch calls to transfer the data, while it doesn’t give us access to the ISA code being run, we can still observe that the hardware limits 16MiB being transferred in a single dispatch before splitting over multiple dispatch calls and we can also see that the transfer size per thread invocation is 16 bytes.
768KiB
Compute Dispatches: 1
Total Threads: 49,152
4MiB
Compute Dispatches: 1
Total Threads: 262,144
16MiB
Compute Dispatches: 1
Total Threads: 1,048,576
32MiB
Compute Dispatches: 2
Total Threads: 1,048,576 + 1,048,576
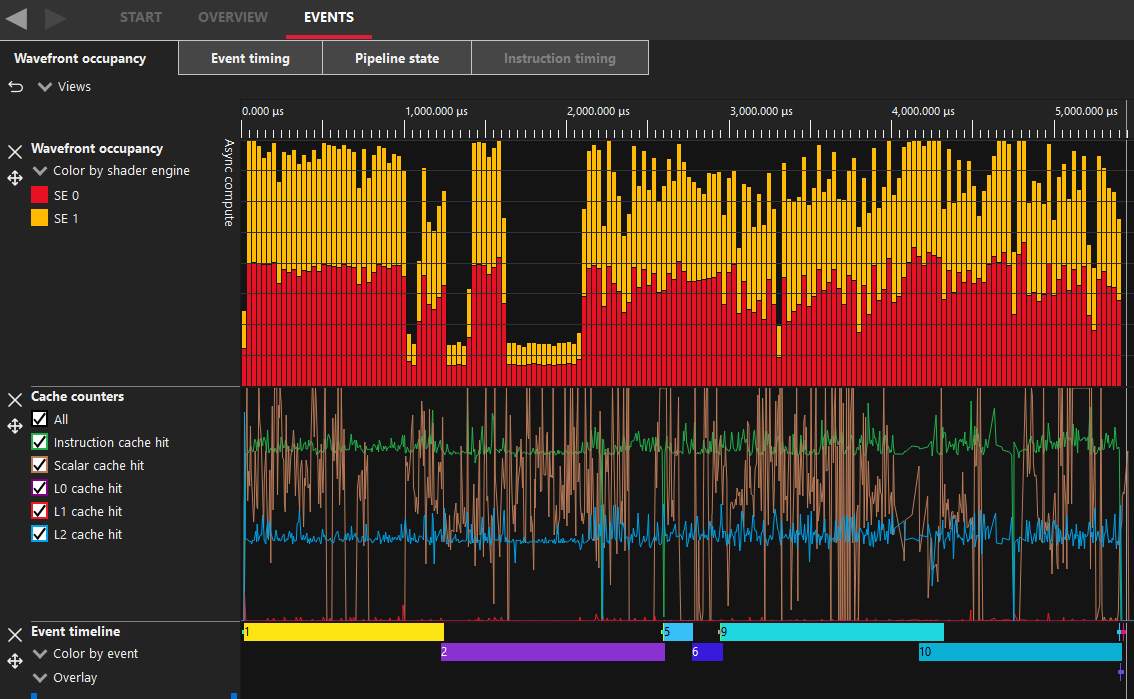
Radeon GPU Profiler
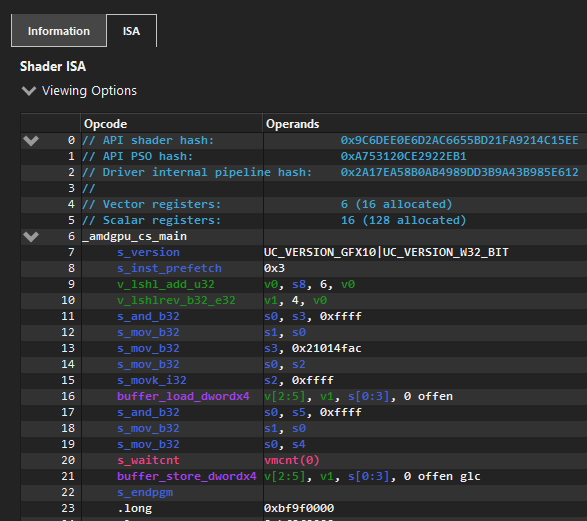
On the left is a screenshot from AMD’s Radeon GPU Profiler from a section where I’m doing 32MiB copies. This has internally been split in to two separate dispatch calls by the driver. Events 1&2 are the CopyResource for UPLOAD->GPU, Events 5&6 for GPU->GPU then 9&10 for GPU->READBACK. The other events here are D3D12 barrier calls.
An interesting difference I observed between UPLOAD->GPU and GPU->GPU is the amount of data processed in the compute shader. The UPLOAD->GPU splits the 32MiB in to two dispatch calls, the same as all others but the thread count is 4,194,304 meaning it’s copying just 4 bytes per thread while the GPU-GPU dispatch call is spawing 1,048,576 threads to copy 16MiB meaning it’s copying 16 bytes per thread. I don’t know the specifics of why this might be, I can only assume it’s more optimal for the given memory types.
One of the limitations of DirectX 12 is that the maximum value you can pass to a dispatch ThreadGroupCount parameter is D3D12_CS_DISPATCH_MAX_THREAD_GROUPS_PER_DIMENSION which is 65536.
Can we do better than the driver?
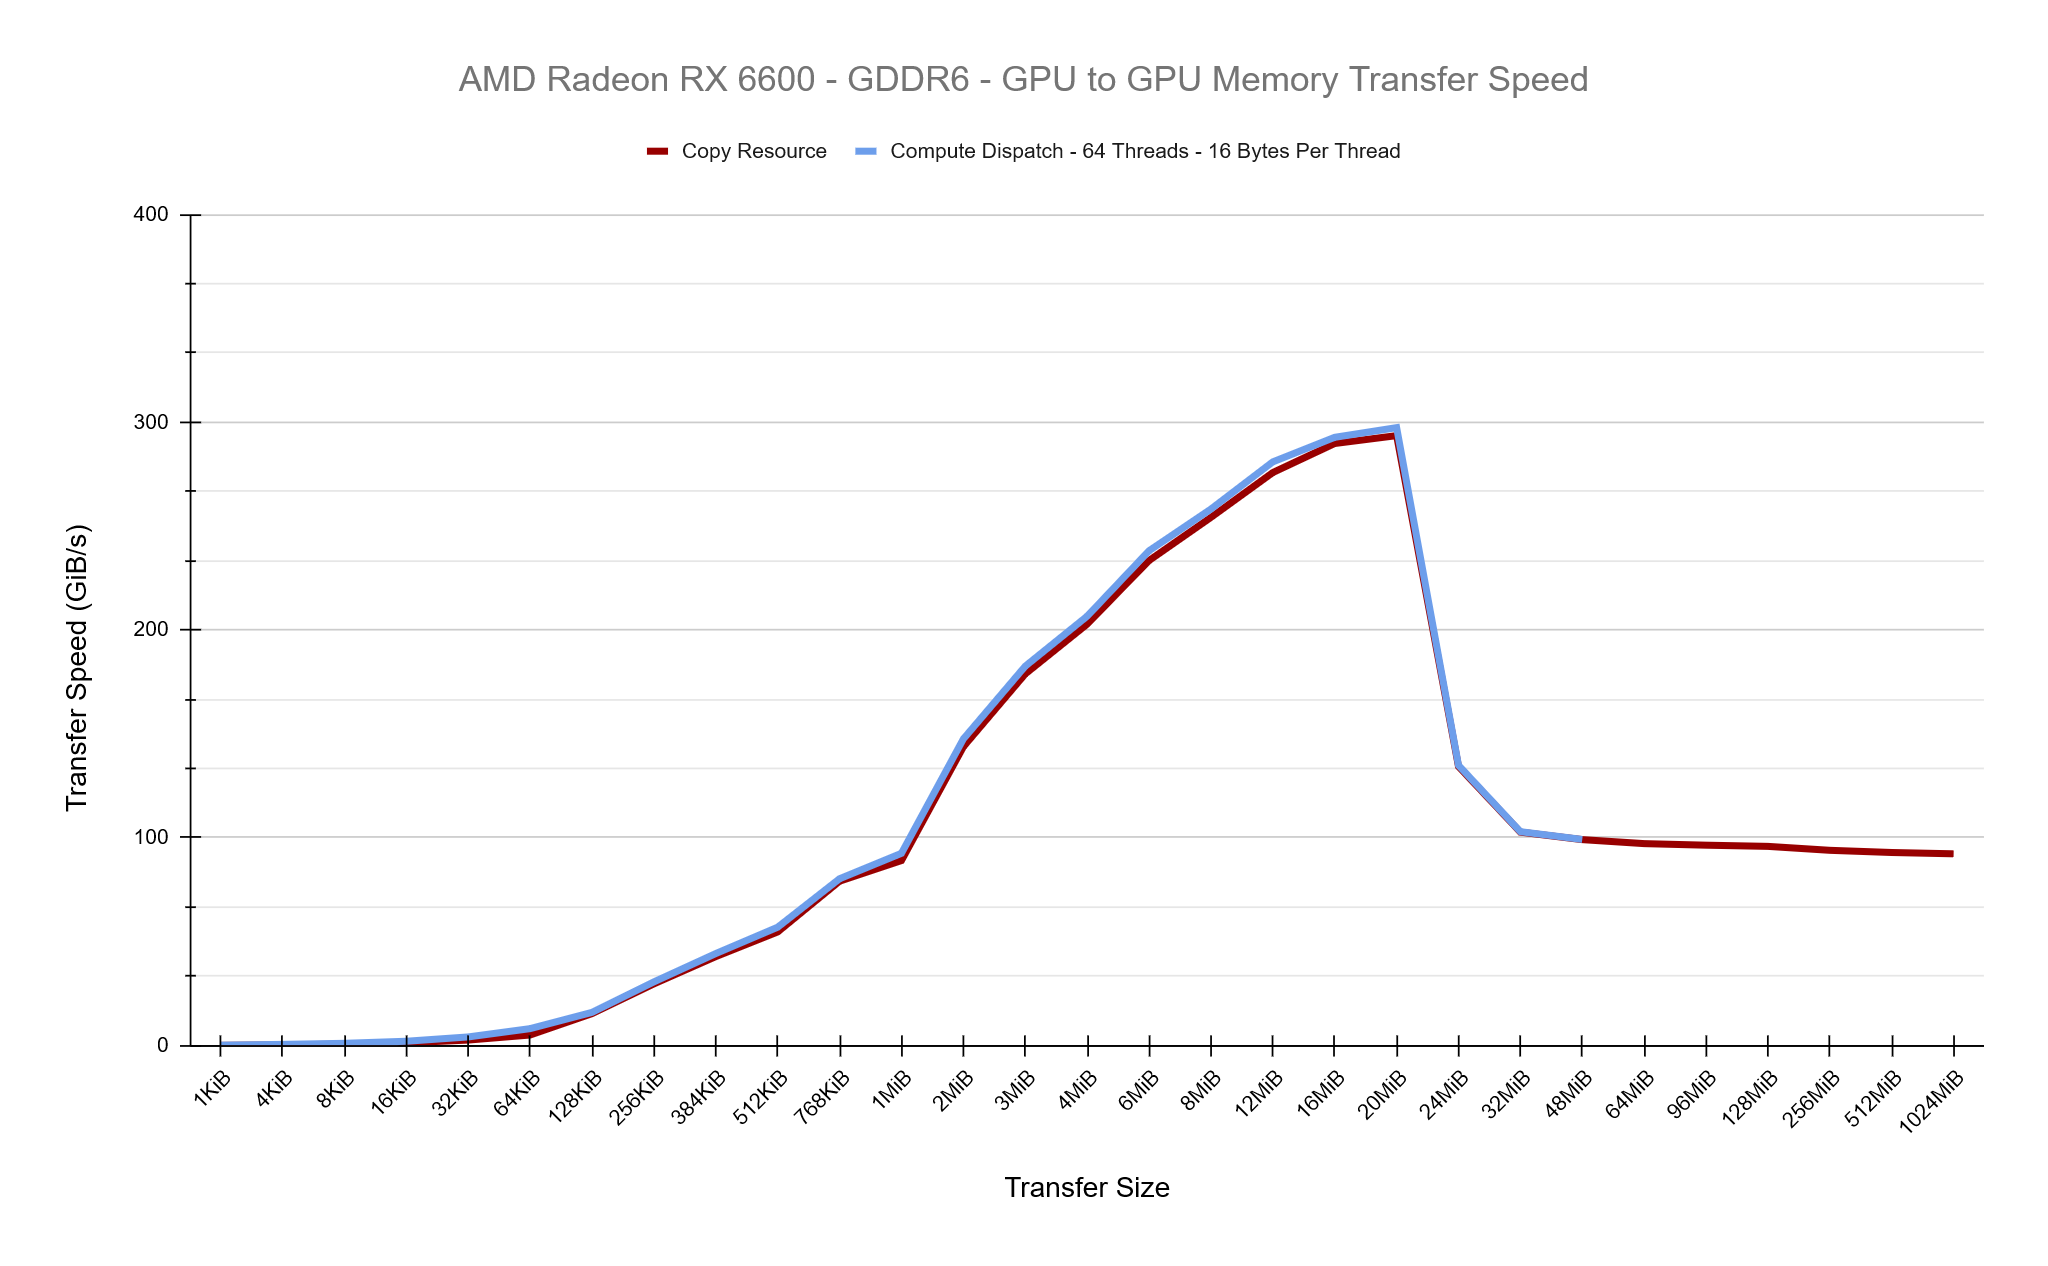
By issuing our own compute dispatch calls can we find a faster setup within DirectX 12 to copy buffers around on the GPU? For these tests we’ll be focusing on GPU to GPU copies and to start with, we’ll write a compute shader that should match what CopyResource is doing as we can tell from Radeon GPU Profiler that CopyResource has a Thread Group Dimension of {64,1,1} and copies 16 bytes of data per shader. This is a good start, you can see in the chart below that the Copy Resource and our Compute Dispatch is roughly equal in their transfer speeds, which is what we expected.
Our Compute Shader which copies 16 bytes per thead and has a Group Dimension of 64 looks like this:
ByteAddressBuffer Source : register(t0);
RWByteAddressBuffer Destination : register(u0);

[numthreads(64, 1, 1)]
void main(uint3 DTid : SV_DispatchThreadID)
{
    uint4 Value = Source.Load4(DTid.x);
    Destination.Store4(DTid.x, Value);
}
The AMD ISA Code for this shader translates to the following when compiled with optimsiatons enabled.
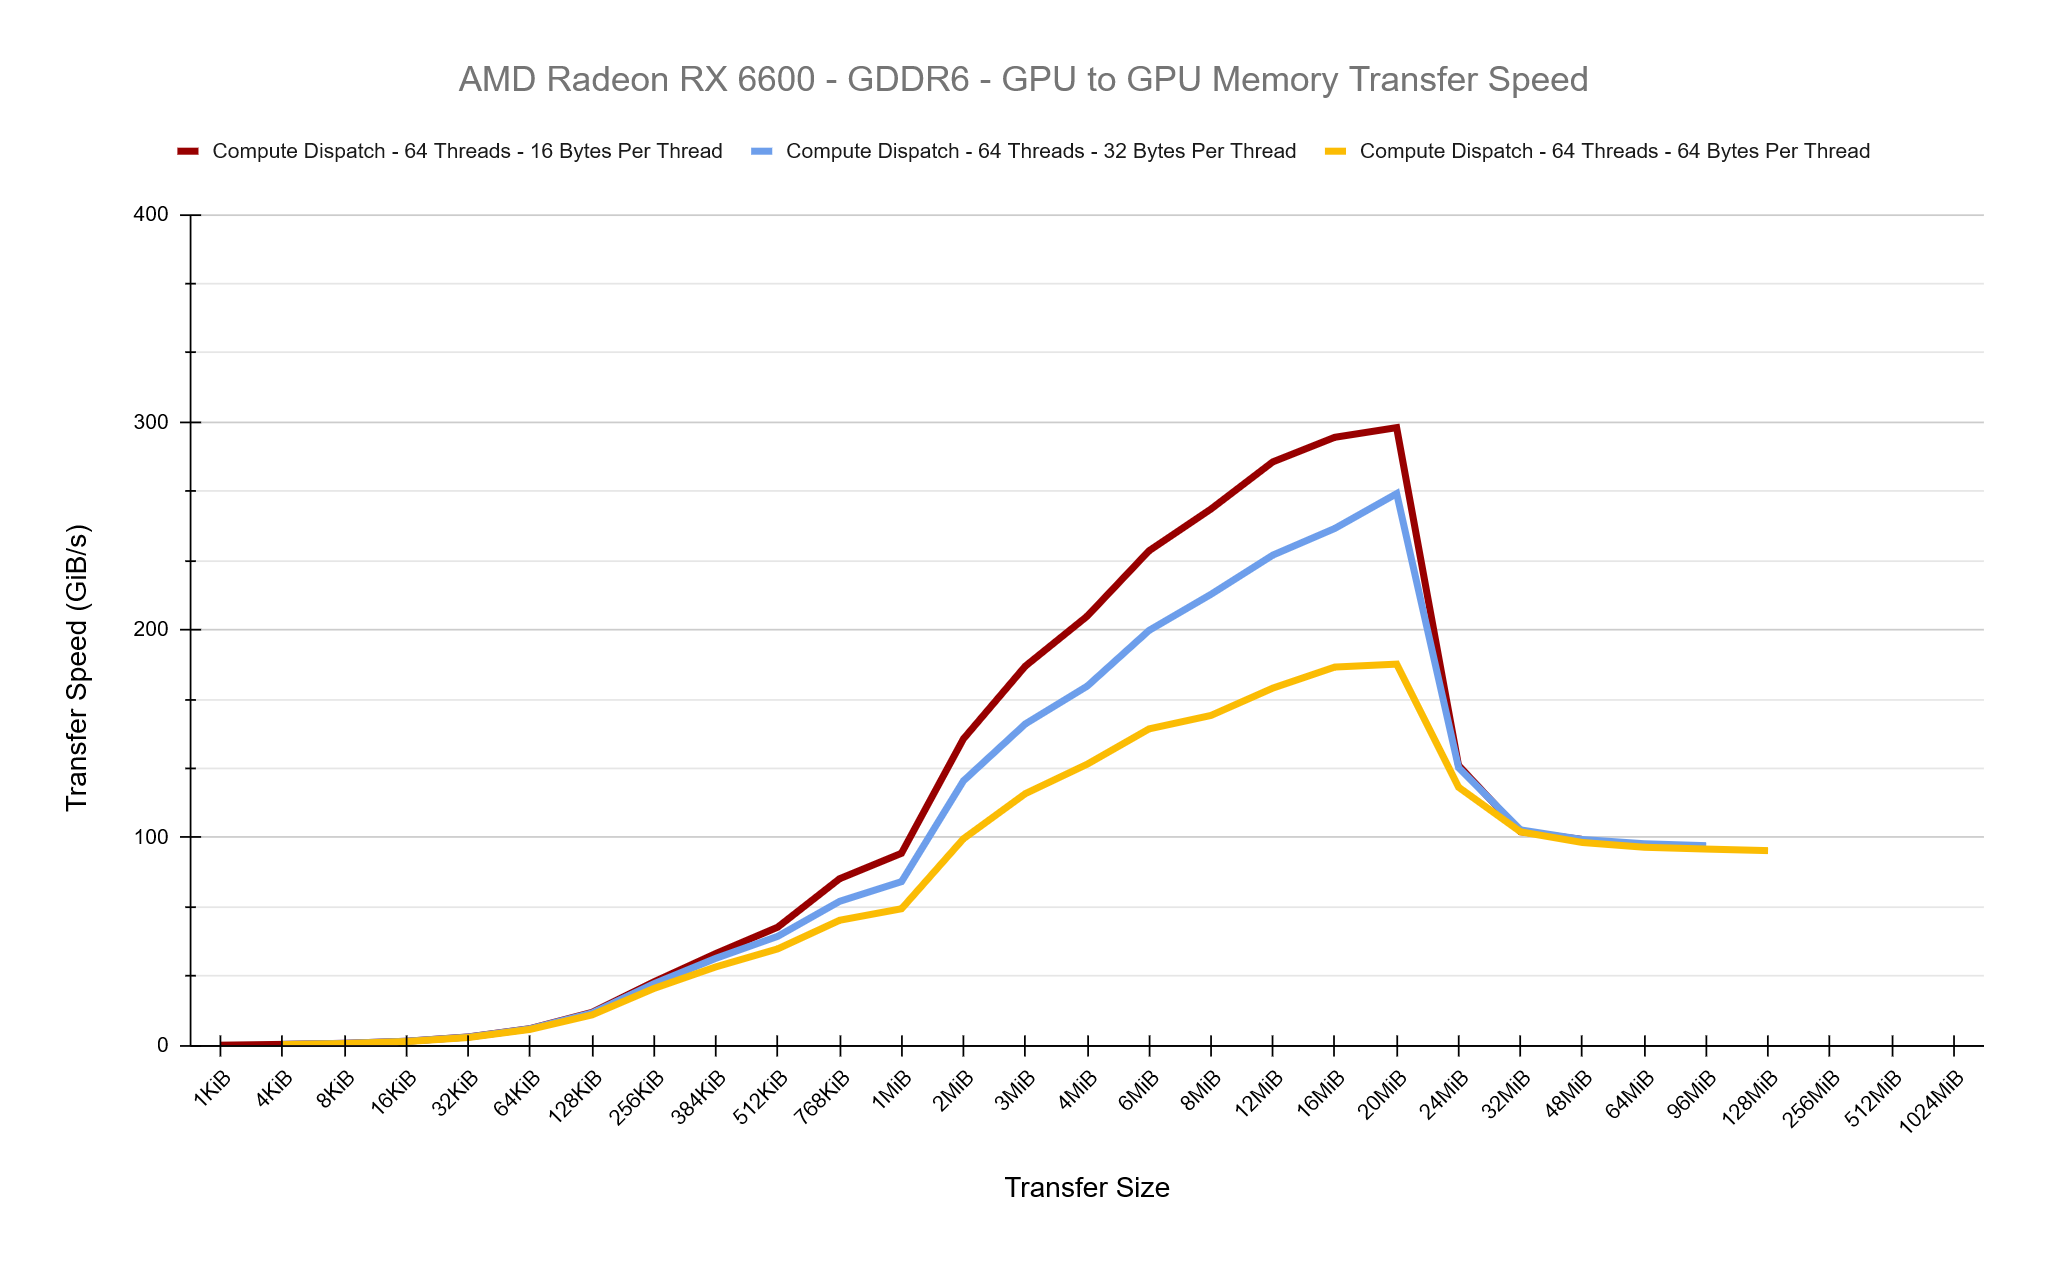
First, lets try increasing the number of bytes copied per thread to see what effect this has while keeping the thread group size as 64. The results below are pretty clear, as we increase the amount of work per thread, we’re losing a lot of performance. Overall, in these tests we are increasing the total amount of work per thread group because we’re maintaining 64 threads per group.
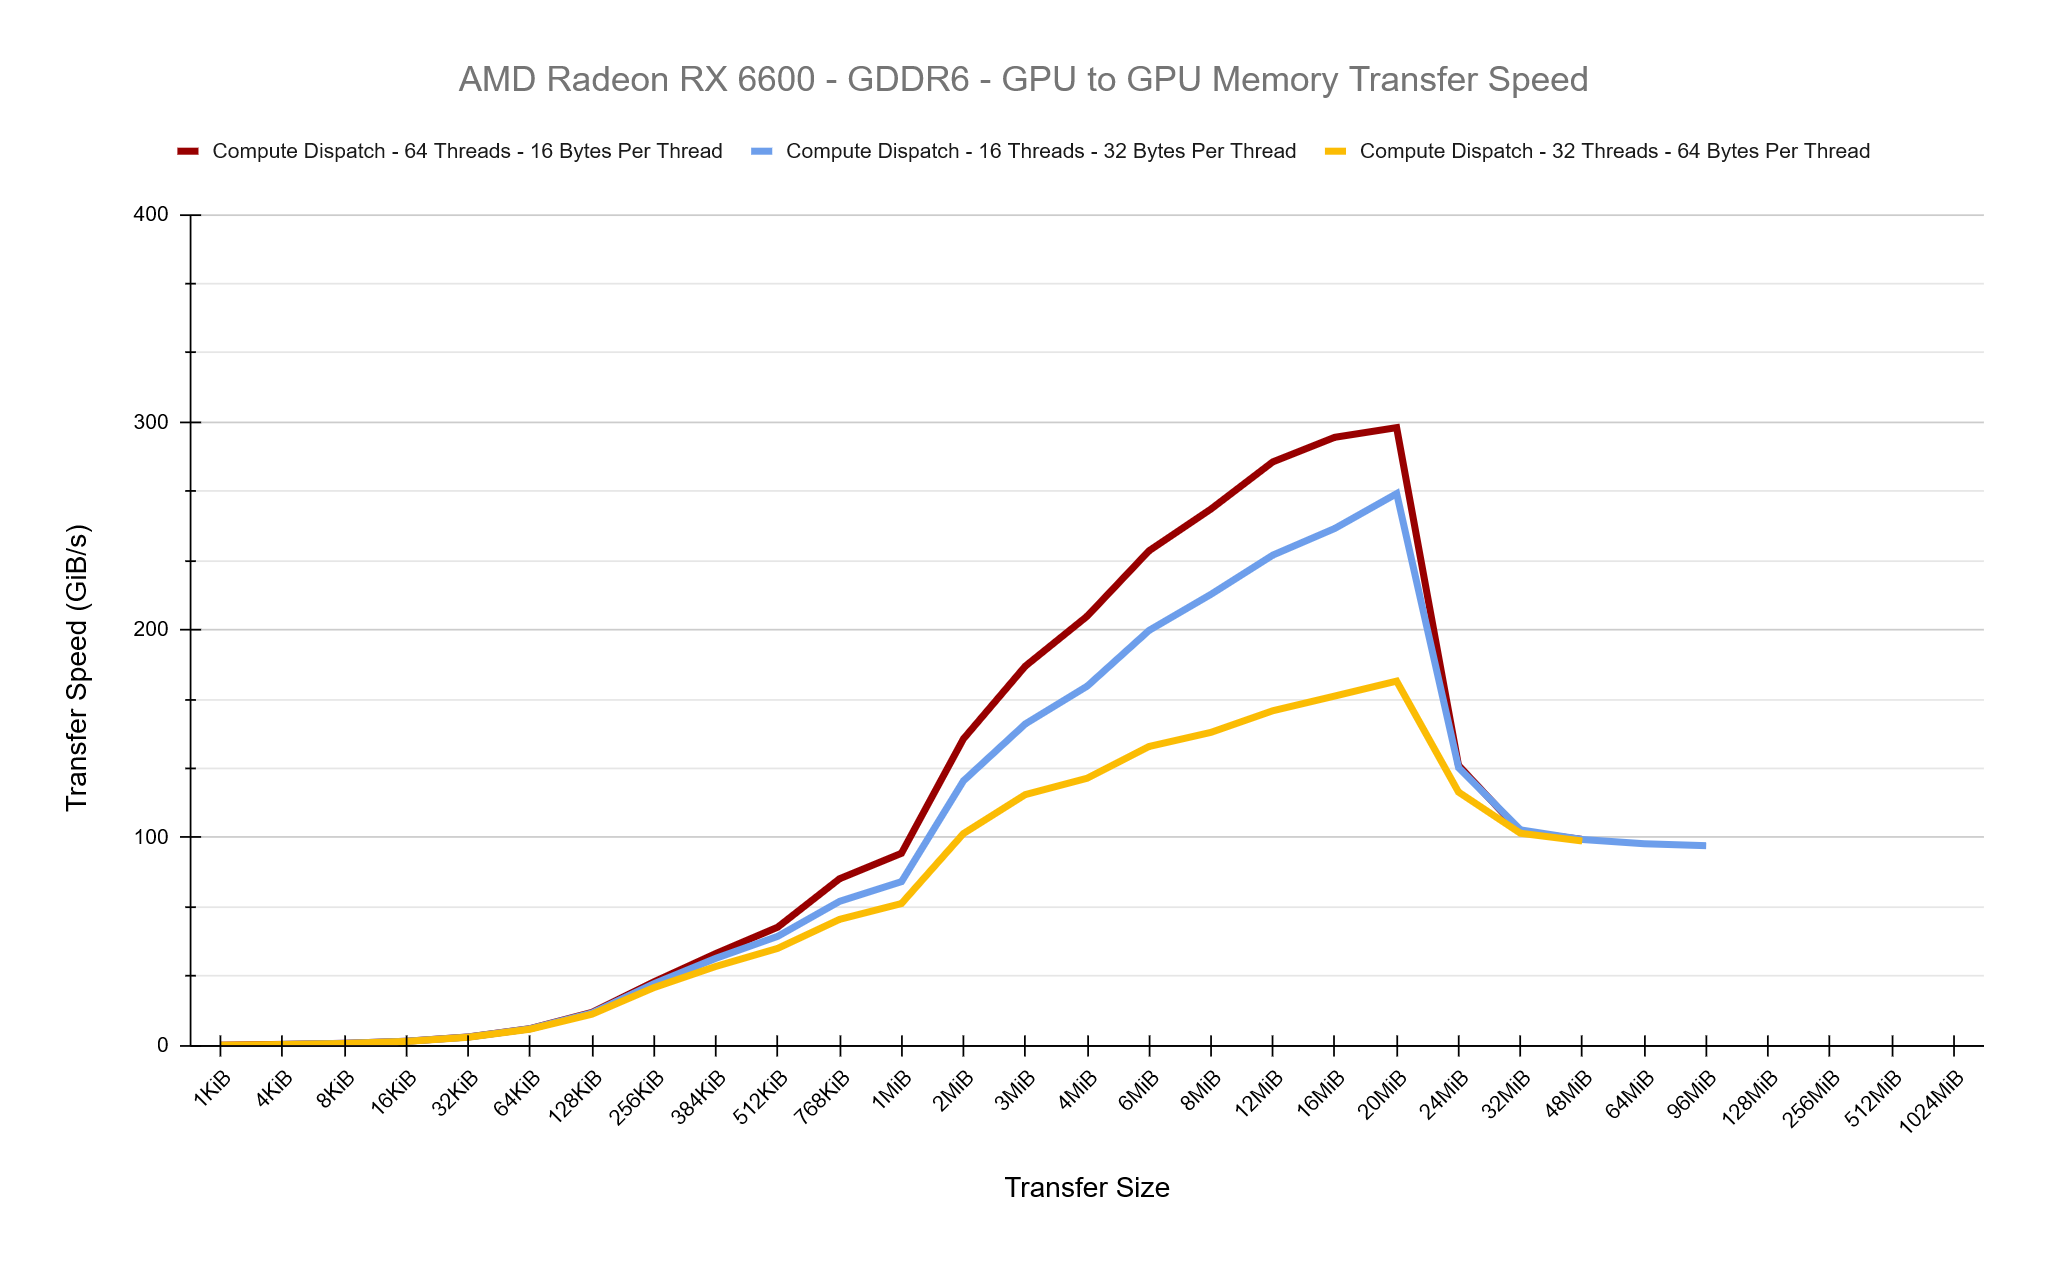
So lets try altering the thread group size to keep each thread group processing a total of 1 KiB of data and see what the results show… They are almost identical to the test above, which clearly suggests it’s nothing to do with the thread group size in these tests and purely the extra work per-thread which is decreasing our performance.
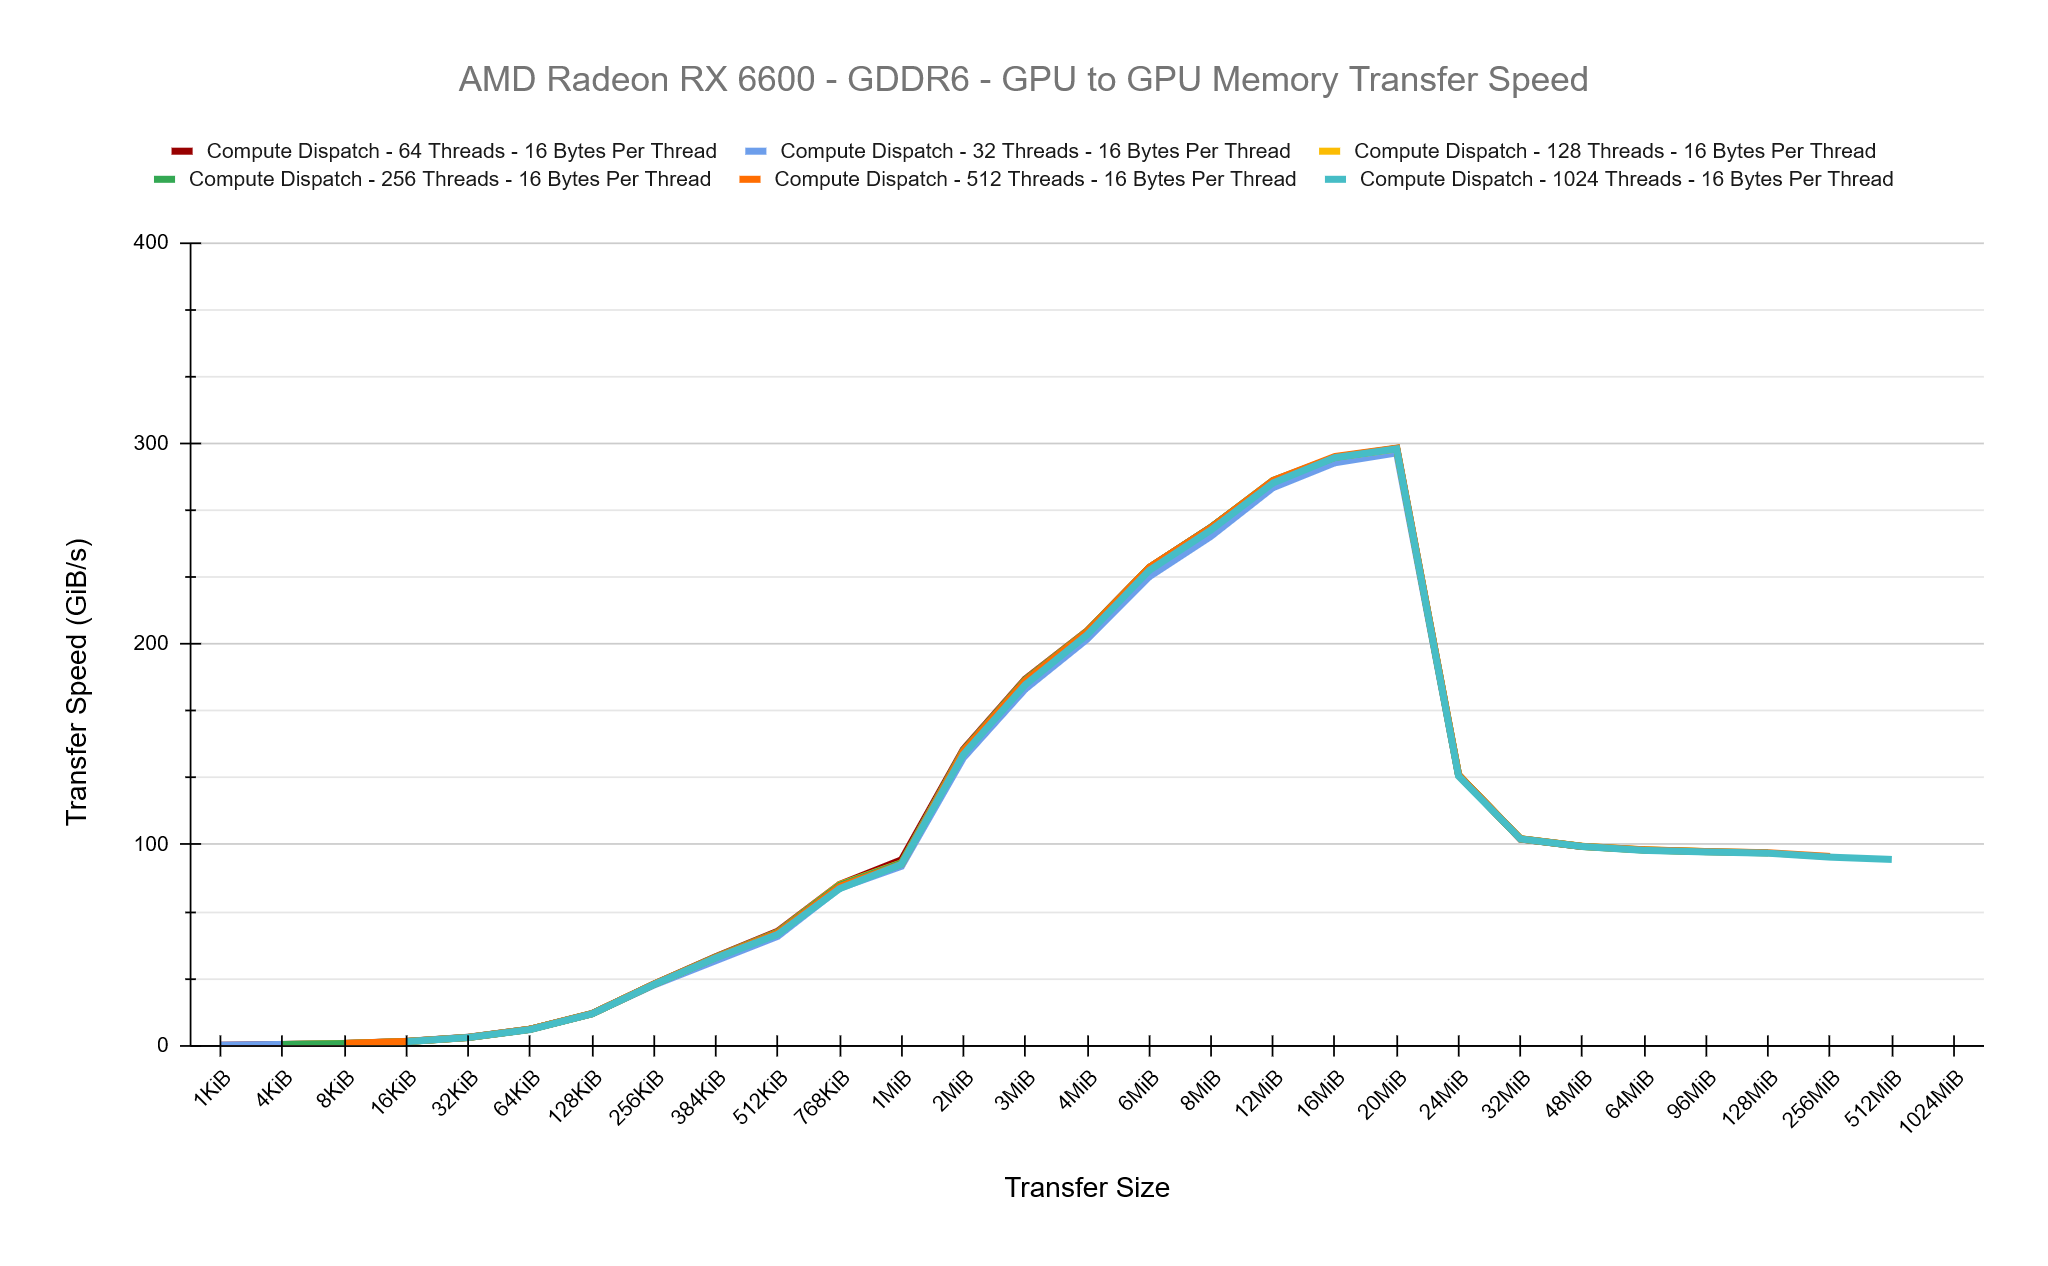
The smallest and most optimal amount of data we can process per thread is 16-bytes, we can see how in the ISA above, the data is read and stored in single instructions. So how does the thread group size affect performance while maintaining 16-bytes per-thread? The chart below shows that testing thread group sizes ranging from 16 to 1024 give roughly equal performance, there are no performance gains here to be had. I believe this is because the GPU is ultiamtely going to be issuing the same number of individual threads to do the copy.
I’d consider all of these results pretty conclusive that the driver is doing a good job under the hood when doing simple buffer copies and we were unable to create a compute dispatch setup which was any better. The data above is from the AMD card but I observed the same behaviour on the Nvidia card too. I also made additional tests comparing CopyBufferRegion and under the hood this appears identical to CopyResource.
I’ve stuck to copying raw data buffers in these tests because I expect more complex render targets or depth buffers will have more driver optimisations applied inherently such as DCC (Delta Colour Compression) as well as Colour Mask and Fast Clear Optimisations in place.
Achieving Consistent Results
I spent a lot of time during these tests ensuring the data I was collecting was accurate. Initially I had my tests sequentially do the UPLOAD->GPU, GPU->GPU GPU-READBACK in the same command buffer with barriers in place but observing Radeon GPU Profiler, the driver was being optimal here and appeared to allow small parts of this work to overlap, meaning I wasn’t accurately timing the cost of each copy operation I was interested in. So I then split each test in to its own command buffer, submitted it to the queue separately and waited for it to finish before timing the next test.
In my initial tests, each command buffer recorded as follows to collect timing data:
- Collect Timestamp Query
- Resource Barriers
- Dispatch or Copy Resource call
- Resource Barriers
- Collect Timestamp Query
- Resolve Query Data
This process initially appear to be accurate for the Copy Resource calls, but when I started issuing my own dispatch calls my timing data on the AMD RX 6600 started to get very inaccurate. The same tests would sometimes come back as taking 2us while other times 45us. Initially I thought perhaps this was related to SetStablePowerState but I ran tests with and without this and I still observed the inconsistency. I felt as if the timing data was being collected before the full operations had start/finished accurately. I observed in the Radeon GPU Profiler that the call to the Resolve Query Data inserted a hard barrier, flusing all caches each time it was invoked. I therefore changed the setup to have two sets of query data each test and resolve them after each collection like so:
- Collect Timestamp Query A
- Resolve Query Data A
- Resource Barriers
- Dispatch or Copy Resource call
- Resource Barriers
- Collect Timestamp Query B
- Resolve Query Data B
My results after this on AMD were much more stable and consistent. I found this behaviour very odd, as it is not expected that you should have to do this, when collecting timing data and I didn’t observe these problems while running on the Nvidia hardware.
Closing Thoughts
It’s been an interesting test to get a glimpse under the hood what’s happening when calling CopyResource writing a testing framework that tries to accurately measure this. You would expect that the driver provided CopyResource would always be the fastest option available, so it’s good to see that we were able to match it with our own compute shader.
Source code for the project can be found here: https://github.com/comeradealexi/GPUWorkSubmissionTiming
Leave a Reply