As my first foray into CUDA programming I set myself a challenge to experiment with different methods of finding the total sum of a large array of numbers, trying different strategies exposed via CUDA to see how different approaches compare and what comes out fastest. A lot of my GPU experience previously on PC has been through DirectX 12 or Vulkan so this felt like a good opportunity to see how programming CUDA compares for a non-graphics or games related workload.
Source Code: https://github.com/comeradealexi/CUDAParallelAddBenchmarks/blob/main/kernel.cu
Test Setup
Each test reads from a large array of integers, adding every entry together and returning the sum. Given the parallel nature of GPUs, we use the atomicAdd function to allow separate threads and blocks to increment the final output value.
For the various test scenarios which are detailed below, we will run with a suite of different block sizes as well as the number of values each thread processes from the input array in an attempt to find the most optimal setup. Block sizes will differ from 32 up to 1024 which has an effect on occupancy as well as the tests involving shared memory.
My expectation is that we’ll get faster results as we reduce the number of times we call atomicAdd, however this isn’t quite what my results find.
With the specific test scenarios below, we will run with the following setups:
- 512MiB Buffer & 1 Kernel Run
- 4 MiB Buffer & 64/128 Kernel Runs
I wanted to test the difference in the results between a very large buffer as well as a small kernel accessed multiple times to ensure I observe the difference in the memory speed overhead. I’m expecting that the 4MiB buffer tests, ran multiple times will remain in the GPU caches and better tests how the code is performing, while I expect the very large buffers to have memory access overheads, potentially resulting in differing results.
Note: In order to ensure stable GPU frequencies, these tests have been run with the following enabled: nvidia-smi -lgc 2800
Test Scenarios
Scenario 1: Atomic Add Per Value Per Thread
Here to demonstrate a suboptimal setup, here we call atomicAdd on every value we loop over per thread.
template<unsigned int VALUES_PER_THREAD>
__global__ void Add_AtomicPerValuePerThread(int* output, const int* input)
{
    const unsigned int workIndex = (threadIdx.x + (blockDim.x * blockIdx.x)) * VALUES_PER_THREAD;

    for (unsigned int i = 0; i < VALUES_PER_THREAD; i++)
    {
        int value = input[workIndex + i];
        atomicAdd(&output[0], value);
    }
}
Scenario 2: Atomic Add Per Thread
Here we calculate our thread total and call atomicAdd only once per thread.
template<unsigned int VALUES_PER_THREAD>
__global__ void Add_AtomicPerThread(int* output, const int* input)
{
    const unsigned int workIndex = (threadIdx.x + (blockDim.x * blockIdx.x)) * VALUES_PER_THREAD;

    int total = 0;
    for (unsigned int i = 0; i < VALUES_PER_THREAD; i++)
    {
        total += input[workIndex + i];
    }
    atomicAdd(&output[0], total);
}
Scenario 3: Reduce Add Sync – Atomic Add Per Warp (32 Threads)
Here we introduce the __reduce_add_sync function which sums the ‘total’ value from all threads in a warp (32 threads) and returns the same value to all threads. Then we only call atomicAdd once per warp. This means we call atomicAdd 32x less overall.
In order to use the wave intrinsic function __reduce_add_sync I had to ensure Code Generation was set to: compute_80,sm_80
template<unsigned int VALUES_PER_THREAD>
__global__ void Add_ReduceAddSyncPerWarp(int* output, const int* input)
{
   const unsigned int workIndex = (threadIdx.x + (blockDim.x * blockIdx.x)) * VALUES_PER_THREAD;

    int total = 0;
    for (unsigned int i = 0; i < VALUES_PER_THREAD; i++)
    {
        total += input[workIndex + i];
    }

    // Sum of all 32 threads in a given warp
    int blockTotal = __reduce_add_sync(0xFFFFFFFF, total);

    // First of every 32 threads atomically increments final output
    if ((threadIdx.x & 31) == 0)
    {
        atomicAdd(&output[0], blockTotal);
    }
}
Scenario 4: Atomic Add To Shared Memory – Atomic Add Per Block
Here every thread in the block atomically increments shared memory, then 1 thread from the block does a final atomic increment. This means we only have 1 atomicAdd per block.
template<unsigned int VALUES_PER_THREAD>
__global__ void Add_AtomicSharedPerThread(int* output, const int* input)
{
    __shared__ int sharedData;
    if (threadIdx.x == 0)
    {
        sharedData = 0;
    }
    __syncthreads();

    const unsigned int workIndex = (threadIdx.x + (blockDim.x * blockIdx.x)) * VALUES_PER_THREAD;

    int total = 0;
    for (unsigned int i = 0; i < VALUES_PER_THREAD; i++)
    {
        total += input[workIndex + i];
    }

    atomicAdd(&sharedData, total);

    __syncthreads();

    if (threadIdx.x == 0)
    {
        atomicAdd(&output[0], sharedData);
    }
}
Scenario 5: Add To Shared Memory Array – Atomic Add Per Block
Here instead of atomically incrementing a single shared data between threads, each increments its own shared value. Then the final thread loops over this and sums them. We expect this to potentially be inefficient because we rely on a single thread from the entire block to do a lot of processing while other threads are idle.
template<unsigned int VALUES_PER_THREAD>
__global__ void Add_SharedUniqueEntryPerThread(int* output, const int* input) // Global atomic increments = Total Threads / Block Size
{
    constexpr int SHARED_DATA_LENGTH = 1024;
    __shared__ int sharedData[SHARED_DATA_LENGTH];

    const unsigned int workIndex = (threadIdx.x + (blockDim.x * blockIdx.x)) * VALUES_PER_THREAD;

    int total = 0;
    for (unsigned int i = 0; i < VALUES_PER_THREAD; i++)
    {
        total += input[workIndex + i];
    }
    sharedData[threadIdx.x] = total;

    __syncthreads();

    if (threadIdx.x == 0) // First thread in the block loops over all shared data.
    {
        int blockTotal = 0;
        for (int i = 0; i < blockDim.x; i++)
        {
            blockTotal += sharedData[i];
        }
        atomicAdd(&output[0], blockTotal);
    }
}
Scenario 6: Shared Memory Array + Reduce Add Sync + Atomic Add Per Block
Here we combine the features of all the other tests by using shared memory and __reduce_add_sync
template<unsigned int VALUES_PER_THREAD, unsigned int BLOCK_SIZE>
__global__ void Add_SharedWithReduceAddSyncPerWarp(int* output, const int* input) // Global atomic increments = Total Threads / Block Size
{
    constexpr int SHARED_DATA_LENGTH = (BLOCK_SIZE / 32) > 0 ? (BLOCK_SIZE / 32) : 1;
    __shared__ int sharedData[SHARED_DATA_LENGTH];

    const unsigned int workIndex = (threadIdx.x + (blockDim.x * blockIdx.x)) * VALUES_PER_THREAD;

    int total = 0;
    for (unsigned int i = 0; i < VALUES_PER_THREAD; i++)
    {
        total += input[workIndex + i];
    }

    int warpTotal = __reduce_add_sync(0xFFFFFFFF, total);

    if ((threadIdx.x & 31) == 0) // Each warp sums all threads in that warp.
    {
        // Divide by warp count
        sharedData[threadIdx.x / 32] = warpTotal;
    }

    __syncthreads();

    if (threadIdx.x == 0)
    {
        int blockTotal = 0;
        for (unsigned int i = 0; i < SHARED_DATA_LENGTH; i++)
        {
            blockTotal += sharedData[i];
        }

        atomicAdd(&output[0], blockTotal);
    }
}
Results
As you would expect, given the number of test scenarios, the differing combinations of block/grid sizes as well as our differing memory sizes, I’ve ended up with a lot of data. I’ll try to share it and analyse it in parts where the results really stood out to me.
Results have been collected on an Nvidia RTX 5060 running on Windows 11 with CUDA 13.2.1. Below are the device capabilities for the Nvidia RTX 5060:
Device 0:
  Name:                        NVIDIA GeForce RTX 5060
  WarpSize:                    32
  MaxThreadsPerBlock:          1024
  MaxGridSize(X):              2147483647
  MaxGridSize(Y):              65535
  MaxGridSize(Z):              65535
  MaxThreadsDim(X):            1024
  MaxThreadsDim(Y):            1024
  MaxThreadsDim(Z):            64
  SharedMemPerBlock:           49152
  SharedMemPerMultiprocessor:  102400
  MaxThreadsPerMultiProcessor: 1536
  MaxBlocksPerMultiProcessor:  24
  MultiProcessorCount:         30
  SMCount:                     30
  MinSMPartitionSize:          8
  SMCoscheduledAlignment:      8
  WQConcurrencyLimit:          8
512MiB x 1 Results:
Comparing tests with same block sizes:
Here we are comparing all 6 of our test scenarios with the same block and grid sizes, so each test issues exactly the same number of threads. All of these test scenarios achieve a potential occupancy of 100%.
The part that surprised me here is just how close majority of these results are in terms of performance, especially the first three results. Add_AtomicPerThread does 512 global atomic increments per block and it’s performing better than several tests which do fewer global atomic increments.Add_AtomicPerValuePerThread is the outlier here, with such a large number of atomic increments per thread, showing an 80% increase in performance compared to our fastest scenario.
| Test < ValuesSummedPerThread, BlockSize > | Average Time (ms) | Global Memory Atomic Increments Per Block |
| Add_AtomicSharedPerThread < 16, 512 > | 5.1212 | 1 (Shared Memory Atomic Increments Per Block = 512) |
| Add_AtomicPerThread < 16, 512 > | 5.1213 | 512 |
| Add_SharedUniqueEntryPerThread < 16, 512 > | 5.2586 | 1 |
| Add_SharedWithReduceAddSyncPerWarp < 16, 512 > | 5.3104 | 1 |
| Add_ReduceAddSyncPerWarp < 16, 512 > | 5.6654 | 16 (Increment per warp which is 32 threads) |
| Add_AtomicPerValuePerThread < 16, 512 > | 9.1421 | 8,192 |
How occupancy affects results:
Focusing in on the Add_AtomicPerThread scenario, it’s quite clear here how not achieving full occupancy is having a detrimental effect on the test results, to the point where the time is more than doubled when comparing 100% to 50% occupancy. This suggests that each SM is spending time idle, likely waiting for memory operations to complete and cannot spend that time processing more warps due to the tests not achieving full occupancy.
| Test < ValuesSummedPerThread, BlockSize > | Average Time (ms) | Occupancy |
| Add_AtomicPerThread < 1, 32 > | 20.0118 | 50% |
| Add_AtomicPerThread < 1, 128 > | 8.4007 | 100% |
| Add_AtomicPerThread < 1, 512 > | 8.4272 | 100% |
| Add_AtomicPerThread < 1, 1024 > | 10.7840 | 66.7% |
4MiB x 64 Results:
With the 4MiB tests, where each scenario is run 64 times back to back, we are expecting very different results to the single 512MiB tests because we expect the input memory to always remain within the GPU caches, so less time is spent waiting on memory operations. We’ll start by comparing the fastest results for each test scenario:
| Test < ValuesSummedPerThread, BlockSize > | Average Time (ms) | Global Memory Atomic Increments Per Block |
| Add_AtomicSharedPerThread < 4, 128 > | 0.8802 | 1 (Shared Memory Atomic Increments Per Block = 128) |
| Add_SharedWithReduceAddSyncPerWarp < 4, 128 > | 0.9538 | 1 |
| Add_ReduceAddSyncPerWarp < 8, 64 > | 1.0817 | 2 (Increment per warp which is 32 threads) |
| Add_SharedUniqueEntryPerThread < 4, 128 > | 1.1001 | 1 |
| Add_AtomicPerThread < 8, 512 > | 1.1047 | 512 |
| Add_AtomicPerValuePerThread < 1, 512 > | 4.1136 | 512 |
The results here align more with our initial expectations where the performance scales with the number of atomic increments per thread. But the difference is only small, comparing the fastest Add_AtomicSharedPerThread to to Add_AtomicPerThread, there are 512x more global atomic increments per thread, but performance is only 1.25x slower.
Importance of keeping the GPU saturated
The results below show the how increasing the amount of work done per-thread decreases performance. Each SM on the GPU is designed to have many blocks assigned to it, ready to execute when other threads become blocked in order to keep the GPU constantly working. If there aren’t enough threads available to the SMs, we just end up wasting performance.
| Test < ValuesSummedPerThread, BlockSize > | Average Time (ms) | Total Threads |
| Add_AtomicSharedPerThread< 4, 512> | 2.2088 | 131,072 |
| Add_AtomicSharedPerThread< 8, 512> | 2.2291 | 65,536 |
| Add_AtomicSharedPerThread< 16, 512> | 4.1010 | 32,768 |
| Add_AtomicSharedPerThread< 32, 512> | 7.9956 | 16,384 |
| Add_AtomicSharedPerThread< 64, 512> | 8.7155 | 8,192 |
| Add_AtomicSharedPerThread< 128, 512> | 10.8872 | 4,096 |
| Add_AtomicSharedPerThread< 256, 512> | 14.6373 | 2,048 |
| Add_AtomicSharedPerThread< 512, 512> | 13.9761 | 1,024 |
| Add_AtomicSharedPerThread< 1024, 512> | 26.4963 | 512 |
| Add_AtomicSharedPerThread< 2048, 512> | 51.9823 | 256 |
| Add_AtomicSharedPerThread< 4096, 512> | 102.4490 | 128 |
| Add_AtomicSharedPerThread< 8192, 512> | 199.3275 | 64 |
| Add_AtomicSharedPerThread< 32768, 128> | 198.4756 | 16 |
Many of the other tests show similar patterns to the above as we increase the amount of work per-thread but often there is a sweet spot. Take a look at the results below, the fastest test is when we are processing 8 values per thread, anything above or below this is slower. Like with many things, it really is a delicate balancing act when you are trying to find the most optimal performance setup. We need to spawn enough threads to keep the GPU saturated, but the sweet spot here is where we can keep the GPU fully saturated but allow each thread to do as much work as possible.
| Test < ValuesSummedPerThread, BlockSize > | Average Time (ms) | Total Threads |
| Add_ReduceAddSyncPerWarp< 1, 64> | 8.4175 | 4,194,304 |
| Add_ReduceAddSyncPerWarp< 2, 64> | 4.8579 | 2,097,152 |
| Add_ReduceAddSyncPerWarp< 4, 64> | 2.9825 | 1,048,576 |
| Add_ReduceAddSyncPerWarp< 8, 64> | 2.2488 | 524,288 |
| Add_ReduceAddSyncPerWarp< 16, 64> | 3.8810 | 262,144 |
| Add_ReduceAddSyncPerWarp< 32, 64> | 7.5115 | 131,072 |
Trace Metrics
512MiB vs 4MiB:
I hypothesised earlier that the performance difference I observed between the 512MiB and 4MiB tests were due to memory bandwidth, lets see if we can prove that using hardware metrics provided by Nvidia Nsight Systems.
We’ll compare the simple Add_AtomicPerThread<8,512> test with 512MiB x 1 run and 4MiB x 128 runs:
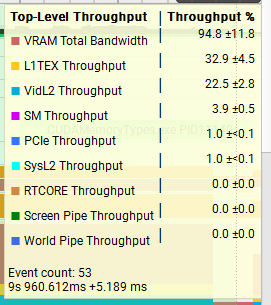
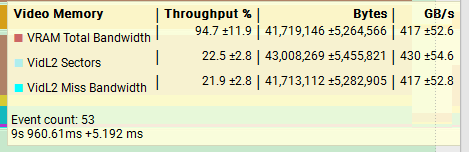
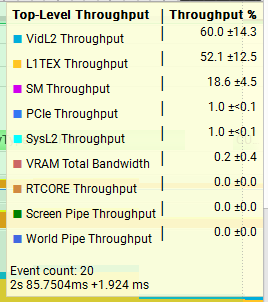
512MiB x 1
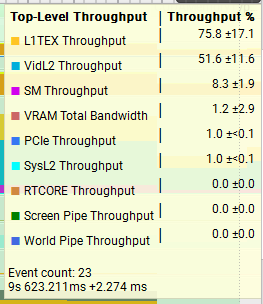
4MiB x 128
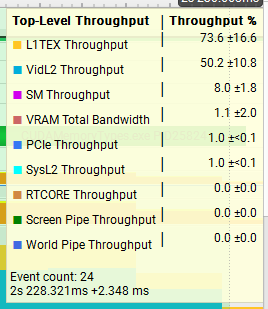
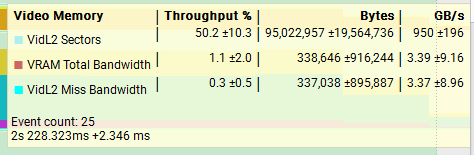
The results show as huge difference in the throughput between the two tests, with the 512MiB test at nearly 95% throughput on VRAM while the 4MiB test is closer to 1%. L1TEX and VidL2 throughput are both also much higher compared to the 512MiB, a good indication that the data we are processing is remaining in the caches and achieving better throughput as a result.
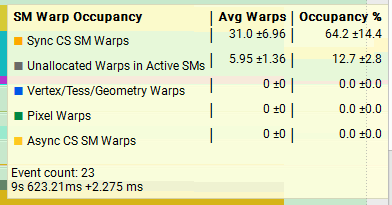
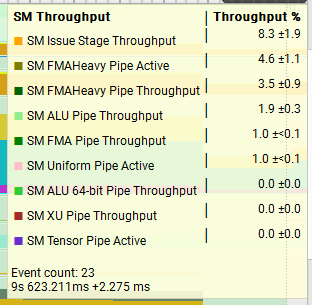
Add_SharedWithReduceAddSyncPerWarp vs Add_AtomicPerThread:
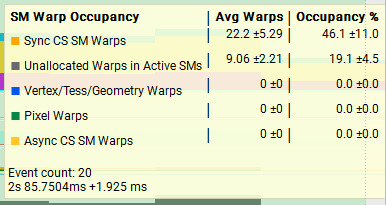
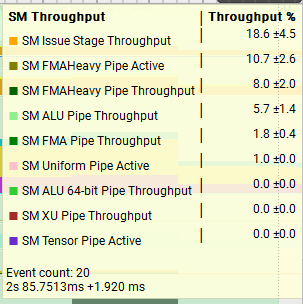
Next, lets compare two very different functions running the 4MiB x 128 test setup and see how the trace metrics look. On average, Add_SharedWithReduceAddSyncPerWarp is faster than Add_AtomicPerThread so it’s interesting to observe that Add_AtomicPerThread has better throughput for L1TEX as well as much better overall warp occupancy. I think it’s important to think about what the throughput stats actually mean, really it’s pointing to us the units which are under the most pressure. We saw above in the 512MiB vs 4MiB test that the VRAM throughput was 95% vs 1%, and this explains the huge difference in performance there, but just because we were achieving 95% throughput in that unit, does not mean it’s faster.
Add_SharedWithReduceAddSyncPerWarp< 4, 128 > (~1.7086ms)
Add_AtomicPerThread< 8, 512 > (~2.1138ms)
Conclusions
The main objective here was a personal objective of mine to introduce myself to CUDA programming, understand how it’s written, how to profile it and performance characteristics.
I think one thing that’s shown here is how in order to improve performance of your application, you must target what the primary bottleneck is. Simply reducing global atomic operations overall may not be the biggest improvement you can make, if it isn’t your primary bottleneck. Often, one of the most important things you can do is always try to keep the SM units fully saturated with as much work as possible and spread your workload evenly across as many threads as possible.
Something else that has stood out here is that using shared memory is very fast. Often the test scenarios which are more complex, involving more code and doing atomic writes to shared memory are amongst the fastest.
Further Investigations:
- Why is the occupancy so far off 100% for the traces above? What could be done to improve this further?
- Are there other CUDA features that could improve our parallel add further? Such as using CUDA Tiles or Clusters? Or Tensor features?
- How would these results differ on different GPUs?
- Are there more trace statistics we can gather to better understand our results, or better understand our existing trace data?
Source Code is accessible here: https://github.com/comeradealexi/CUDAParallelAddBenchmarks/blob/main/kernel.cu
Leave a Reply