Should you always throw more threads at a problem to try and make it faster? As with so many problems in computing the answers is often “It Depends”. In this post, I will explore the effect of increasing thread usage in a program who’s workload is heavily bottlenecked by memory performance. I will explore how the data corresponds with hardware cache sizes on the CPU as well as some methods to improve the problem (or make them worse). We will also explore how adjusting thread affinity can impact the results.
Test Setup ⚙️
The workload I’ll be measuring performance on is a simple loop iterating over a linked list of varying sizes until it reaches the end on a contiguous block of allocated memory. This means our loop will be accessing the memory linearly which is optimal and we’ll be running the test many times and averaging the results. We are expecting smaller sized workloads to run faster because our block of memory will remain in the CPU caches and then performance to deteriorate for larger workloads as we exceed the cache sizes.
The test results here are from benchmarks on a Raspberry Pi 3 running an ARM Cortex-A53 clocked at 1.2 GHz.
Below is a report of the cache layout of our hardware from hwloc/lstopo. It highlights that we have 4 cores each with a 32KiB L1 data cache and all 4 cores share a 512KiB L2 cache. There is no L3 cache.
Machine (906MB total)
  Package L#0
    NUMANode L#0 (P#0 906MB)
    L2 L#0 (512KB)
      L1d L#0 (32KB) + L1i L#0 (32KB) + Core L#0 + PU L#0 (P#0)
      L1d L#1 (32KB) + L1i L#1 (32KB) + Core L#1 + PU L#1 (P#1)
      L1d L#2 (32KB) + L1i L#2 (32KB) + Core L#2 + PU L#2 (P#2)
      L1d L#3 (32KB) + L1i L#3 (32KB) + Core L#3 + PU L#3 (P#3)
Single Thread Performance Results
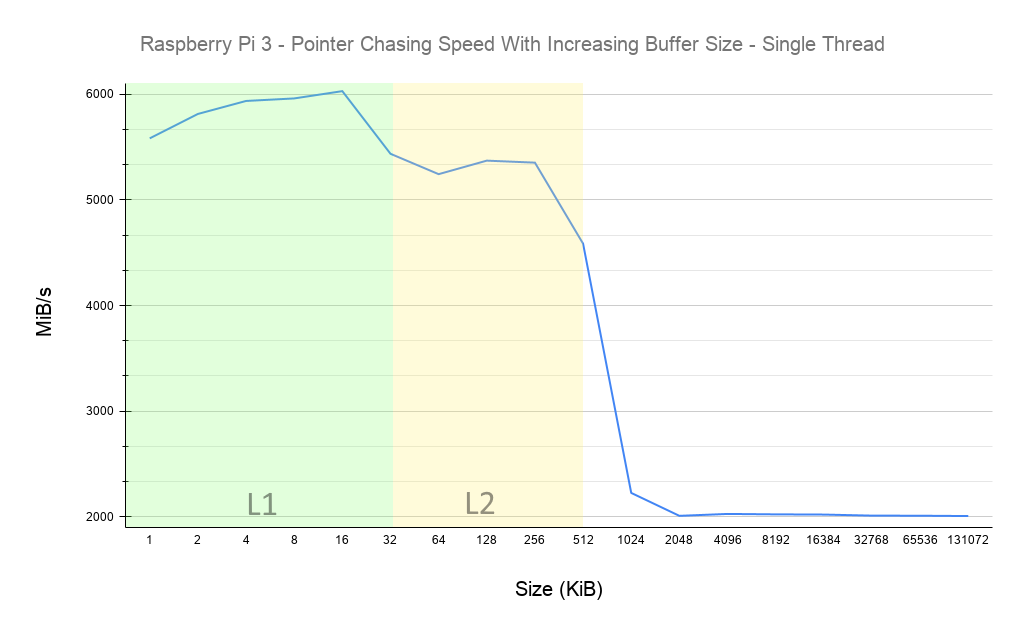
Lets start with a set of single threaded results to get an idea of baseline performance. The results here align with our expectations and we can see how performance drops once we exceed L1 and L2 cache sizes. The results here align with graphs you’ll find in the excellent paper “What Every Programmer Should Know About Memory”.
Peak single threaded speed is around 6000 MiB/s iterating over a 16KiB buffer and performance starts to tail off once we’re exactly matching the L1 cache size of 32 KiB. We see this same pattern for the L2 cache, maximum speed of about 5250 MiB/s around 256 KiB and falling off as we meet our L2 cache size exactly at 512 KiB. After this, performance plummets and subsequent data sizes are constant at around 2000 MiB/s as the data sizes far exceed the caches and we are spending majority of our time waiting for main memory.
Introducing More Threads 🧵
Now for the interesting part, lets see what happens when we introduce more threads, each working on their own unique workload. For example, in our 16KiB test, each thread will have its own, unique 16KiB piece of memory allocated which it is going to be processing. What I’m interested to explore here is whether, in a situation which is heavily bound by memory bandwidth, whether introducing more threads can improve performance.
We’ll start by focussing on our most optimal single threaded test which processed 16KiB at over 6000 MiB/s.
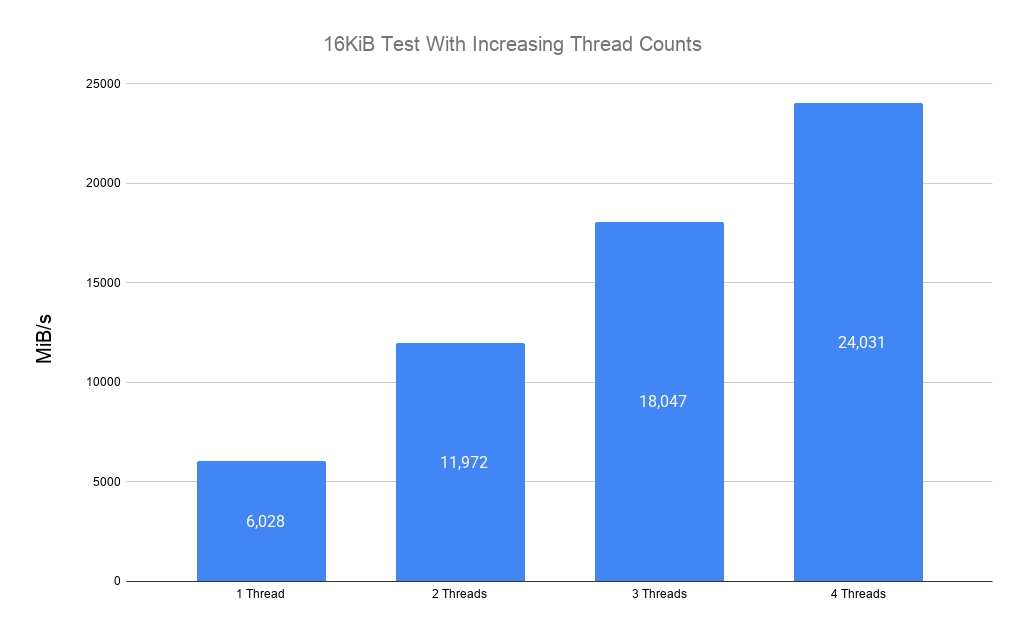
The chart here is showing the sum of the speed of data processed by each thread. The results here area really positive, our performance has scaled just about perfectly across all cores. The ~6000MiB/s single threaded performance scales with each additional thread we have introduced and each thread is independently processing data at ~6000MiB/s This is what we were hoping for with a test processing just 16KiB because we know from our hardware specs that this amount of data should comfortable fit and remain in the L1d cache of each thread.
I also ensure here that each thread has its affinity locked to a single core to prevent the chance of the OS scheduling them across different cores while running and accessing a different L1d cache.
Increasing Data Sizes
So lets see if this pattern we’ve seen here will continue as we increase the amount of data we process. The chart below shows increasing memory test size and how overall performance changes between 1 and 4 threads. Remember, the MiB/s we’re looking at in these results is the total amount of data we are processing across all threads.
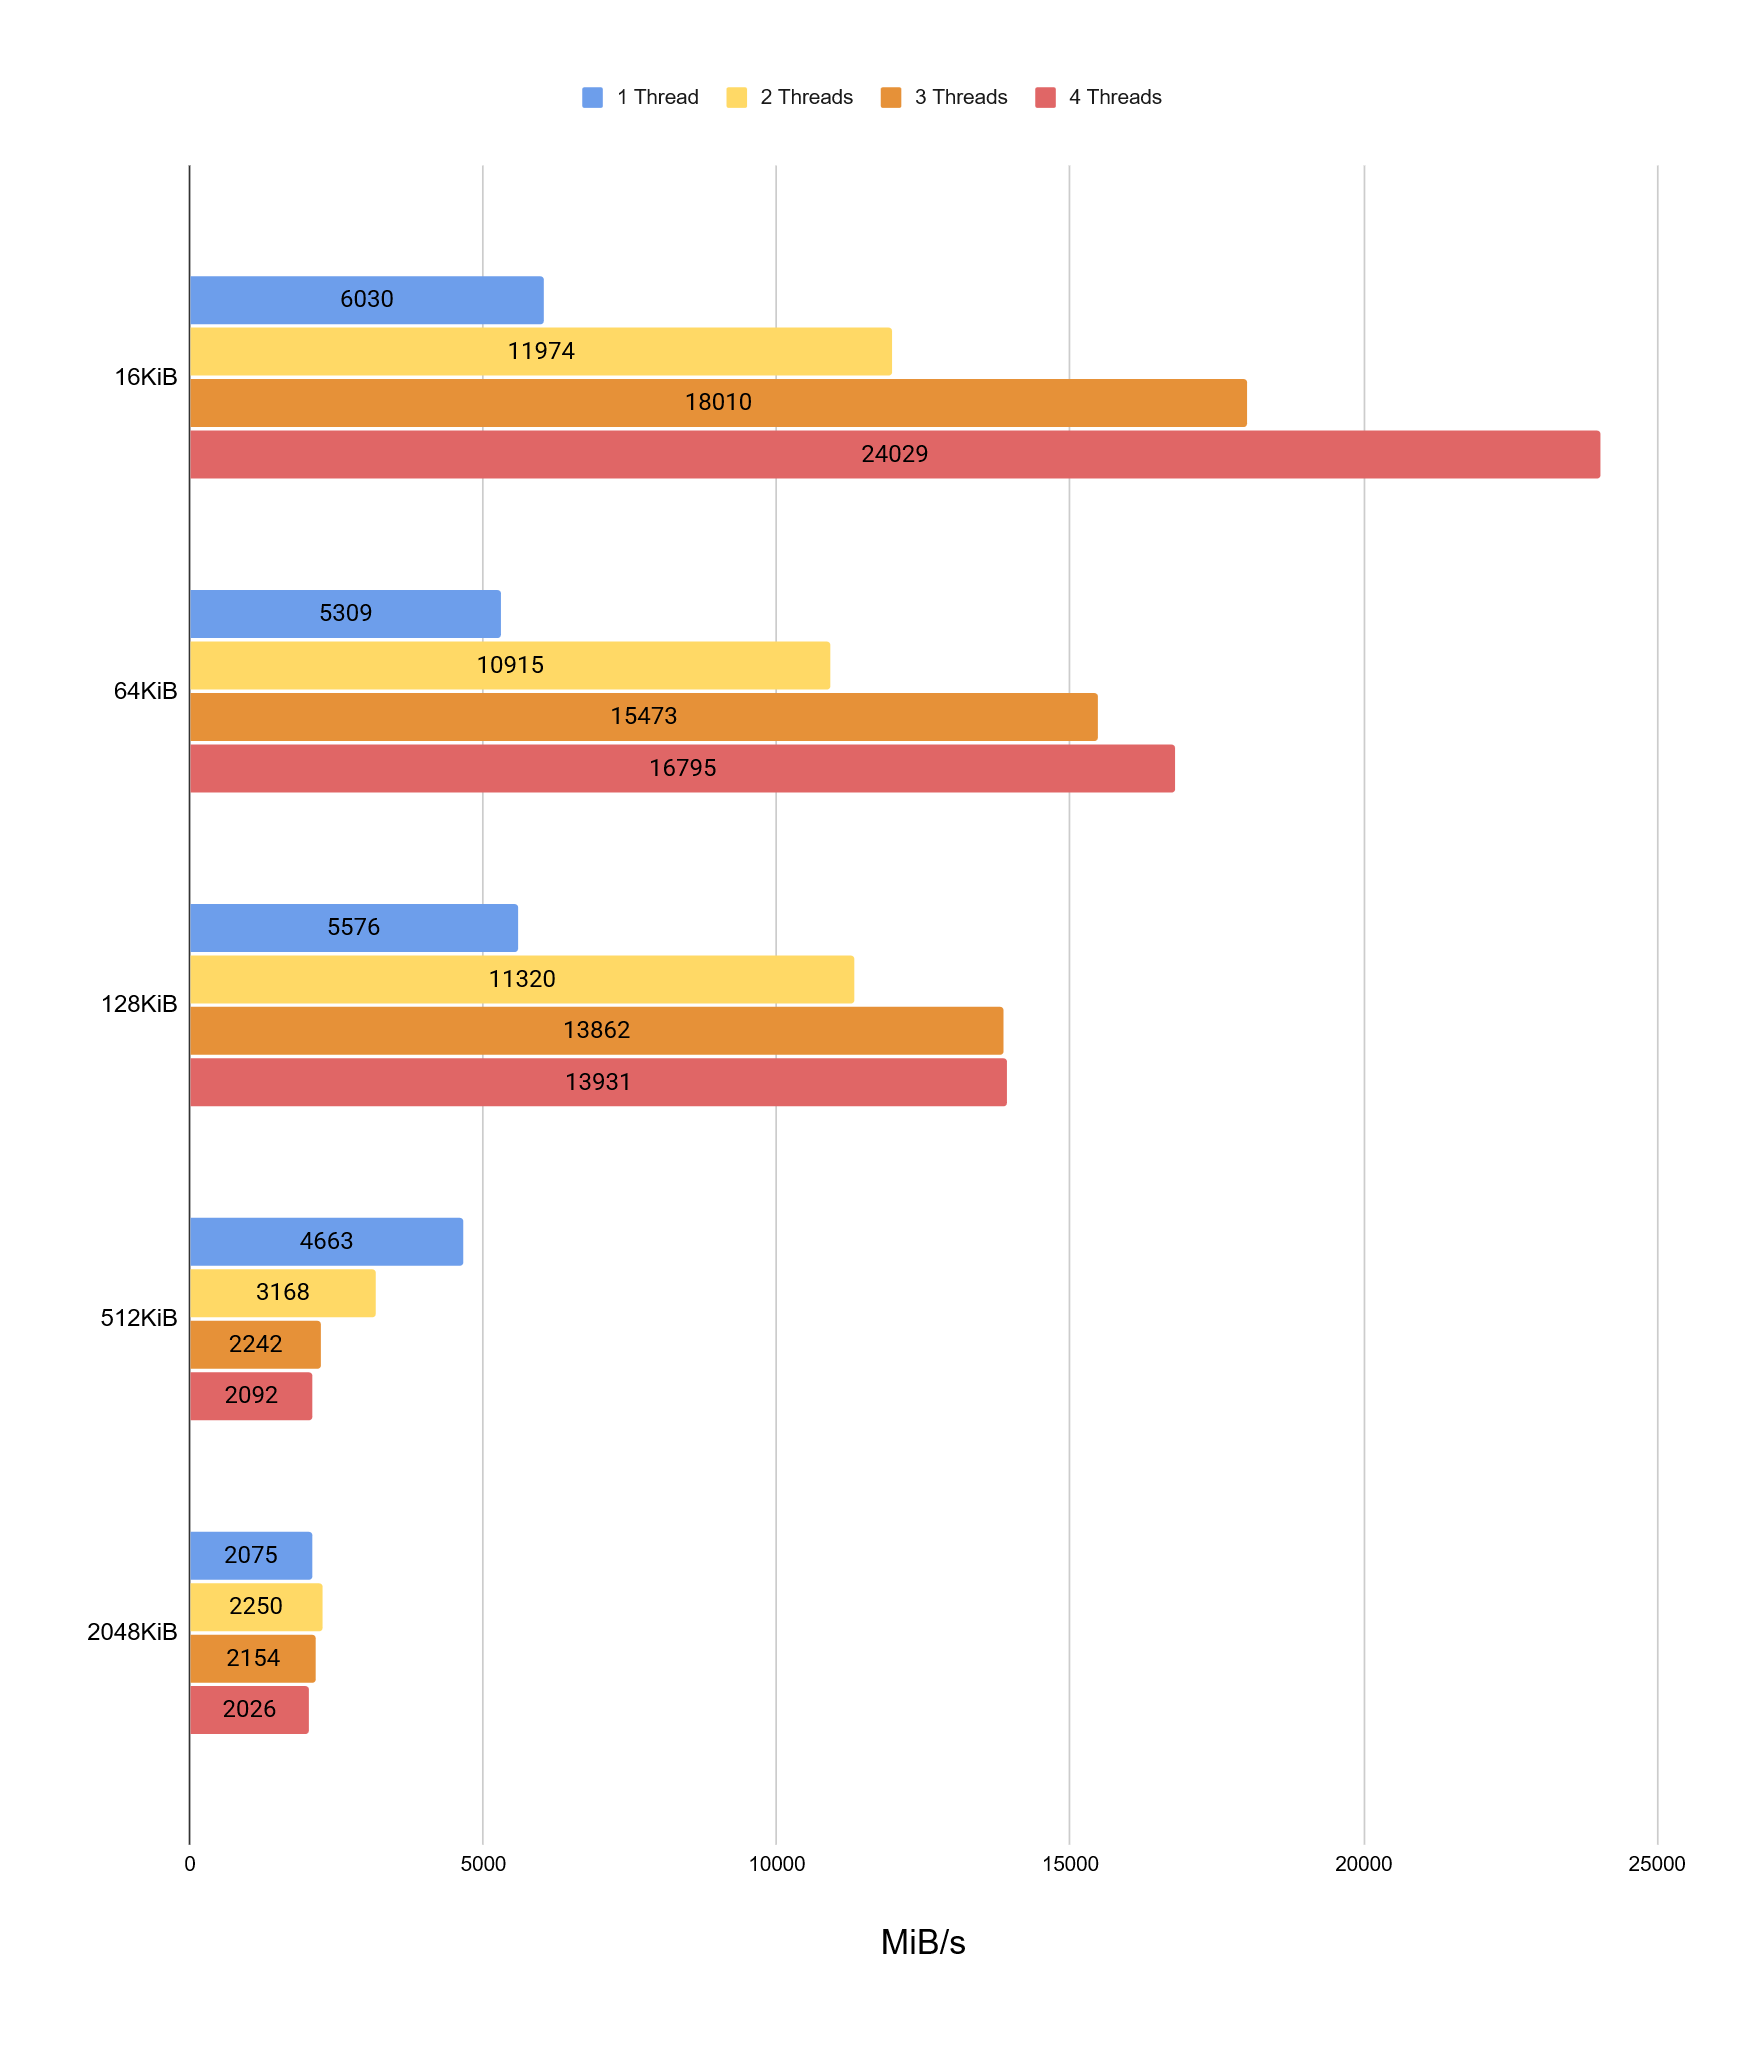
It’s clear right away that the doubling of performance with each thread we see with 16KiB data size quickly starts to diminish. Lets start by analysing what we see with the 64 KiB test. With the 64KiB test, we initially see a doubling of performance up until 3 threads and then see a much smaller increase at 4 threads. This isn’t necessarily what we would have expected though because our hardware has a 512KiB L2 cache and we’re only processing 64KiB per thread (64KiB x 4 = 256KiB) so this should comfortable fit within the L2 cache.
64KiB Analysis
Let’s dig in to the 64KiB performance falloff a little deeper. We’ll do this by using perf, a Linux tool that allows us to easily collect hardware event statistics which will give us a better insight to what’s actually happening at the hardware level.
We’ll focus on hardware events that will tell us the following:
- Number of instructions executed per-cycle
- Percentage of L1 cache misses
- Percentage of L2 cache misses
- Percentage of cycles waiting on memory read operations (ld_dep_stall)
| Metric | 1 Thread | 2 Threads | 3 Threads | 4 Threads |
| Instructions Per Cycle | 0.90 | 0.89 | 0.83 | 0.71 |
| L1 Cache Refill Percent | 1.6% | 1.5% | 1.9% | 1.9% |
| L2 Cache Refill Percent | 0.0014% | 0.0017% | 0.0022% | 0.0046% |
| Percent Cycles ld_dep_stall | 10% | 11% | 17% | 29% |
Lets focus on the L1 and L2 cache refill/miss percentages to start with. It’s clear immediately that the percentages are incredibly low and the kind of increase we see between 1 and 4 threads is unlikely to explain the large drop off in performance we have observed. We already know that our entire test should comfortable fit entirely within the L2 cache.
The number of cycles stalled on ld_dep_stall is where things really get interesting and we see a significant increase from 10% and 11% with one and two threads, then an increase to 17% with 3 threads and a sharp increase to 28% with 4. The pattern we’ve observed here feels like it matches the drop off in performance that we see in the test results. 3 threads isn’t quite 3x the performance of 1 thread, and then 4 threads is even further off.
So what does ld_dep_stall actually mean? perf defines this metric as the following:
Cycles there is a stall in the Wr stage because of a load miss. Unit: armv8_cortex_a53
Our test is almost exclusively making load requests, so it’s not surprising this is the pipeline that is stalling. But why are our tests performing worse, when we’ve mentioned before that our tests fit comfortably within L2 cache… Unfortunately I cannot find any hard evidence to tell me explicitly what is going on through more detailed hardware events but what I believe is happening is we’re pushing and processing so much memory at this point we’re stressing the bandwidth between the L1 and L2 caches. We observed in the 16KiB test, which fits entirely within L1 cache that we saw a perfect multiplying of performance as we increased more threads. The unique situation with our 64KiB test is we’re now exceeding the L1 cache, so our tests are now constantly fetching memory from L2 in to L1.
The great writeup on Chips and Cheese suggests with the A53, all cores & L1 communicate with L2 via a shared data path so could become congested. As I don’t have any hard evidence to support this, I cannot guarantee this is the cause. I explored other hardware metrics such as TLB and cache snooping events but I couldn’t find anything that matched up with the kind of performance increase we observed. I feel if this is the cause, it may be showing due to my tests here perhaps being a worst-case scenario, where every thread is doing nothing but making read requests and very little else. We’re really maxing out the L1 and L2 memory systems on the chips and perhaps what I’ve observed here is a bottleneck between L1 and L2 in this situation. If anyone could shed more light on the situation here, I’d love to talk further about it.
128KiB to 2048KiB Analysis
Taking a look beyond the 64KiB tests, the results start to show different patterns. The one that really stands out to me right away is the 512KiB test. This test aligns exactly with the size of the L2 cache and as we introduce more threads, our overall performance starts to deteriorate. What we’re seeing here is all 4 threads competing for L2 cache space and completely thrashing it, to the point where introducing more threads has overall made our tests slower. With this test, we’d be better off having 1 thread run the 512KiB test 4 times sequentially than distributing the work across 4 separate cores! It’s a really important lesson to be taken here when optimising workloads: throwing more threads at a problem is not always the answers and in some cases, could actually make performance even worse.
Then if we move to the 2048KiB test scenario, performance is roughly equivalent whether we use 1 thread or 4. While in this situation, we haven’t made performance worse by introducing more threads, all we’ve really done is decrease the effect work each thread is doing and possibly increased power consumption! If we had workloads which were not memory intensive, then these would be better candidates to run in parallel with a memory intensive workload.
Adjusting Thread Affinity
In all of the test scenarios above, each thread has been locked to a unique core. I also ran tests which allowed our threads to use any core (each thread has an affinity mask of 0b1111/0xf) and the results were almost identical to the situation when I ran with a locked core. I believe that due to my artificial workload, the thread scheduler was doing a good job of keeping the each thread running on a unique core and didn’t allow them to context switch between cores while the tests were running. I would expect this to potentially be a different situation in a real world scenario, if there are competing threads and regular context switches.
Raspberry Pi power throttling ⚡
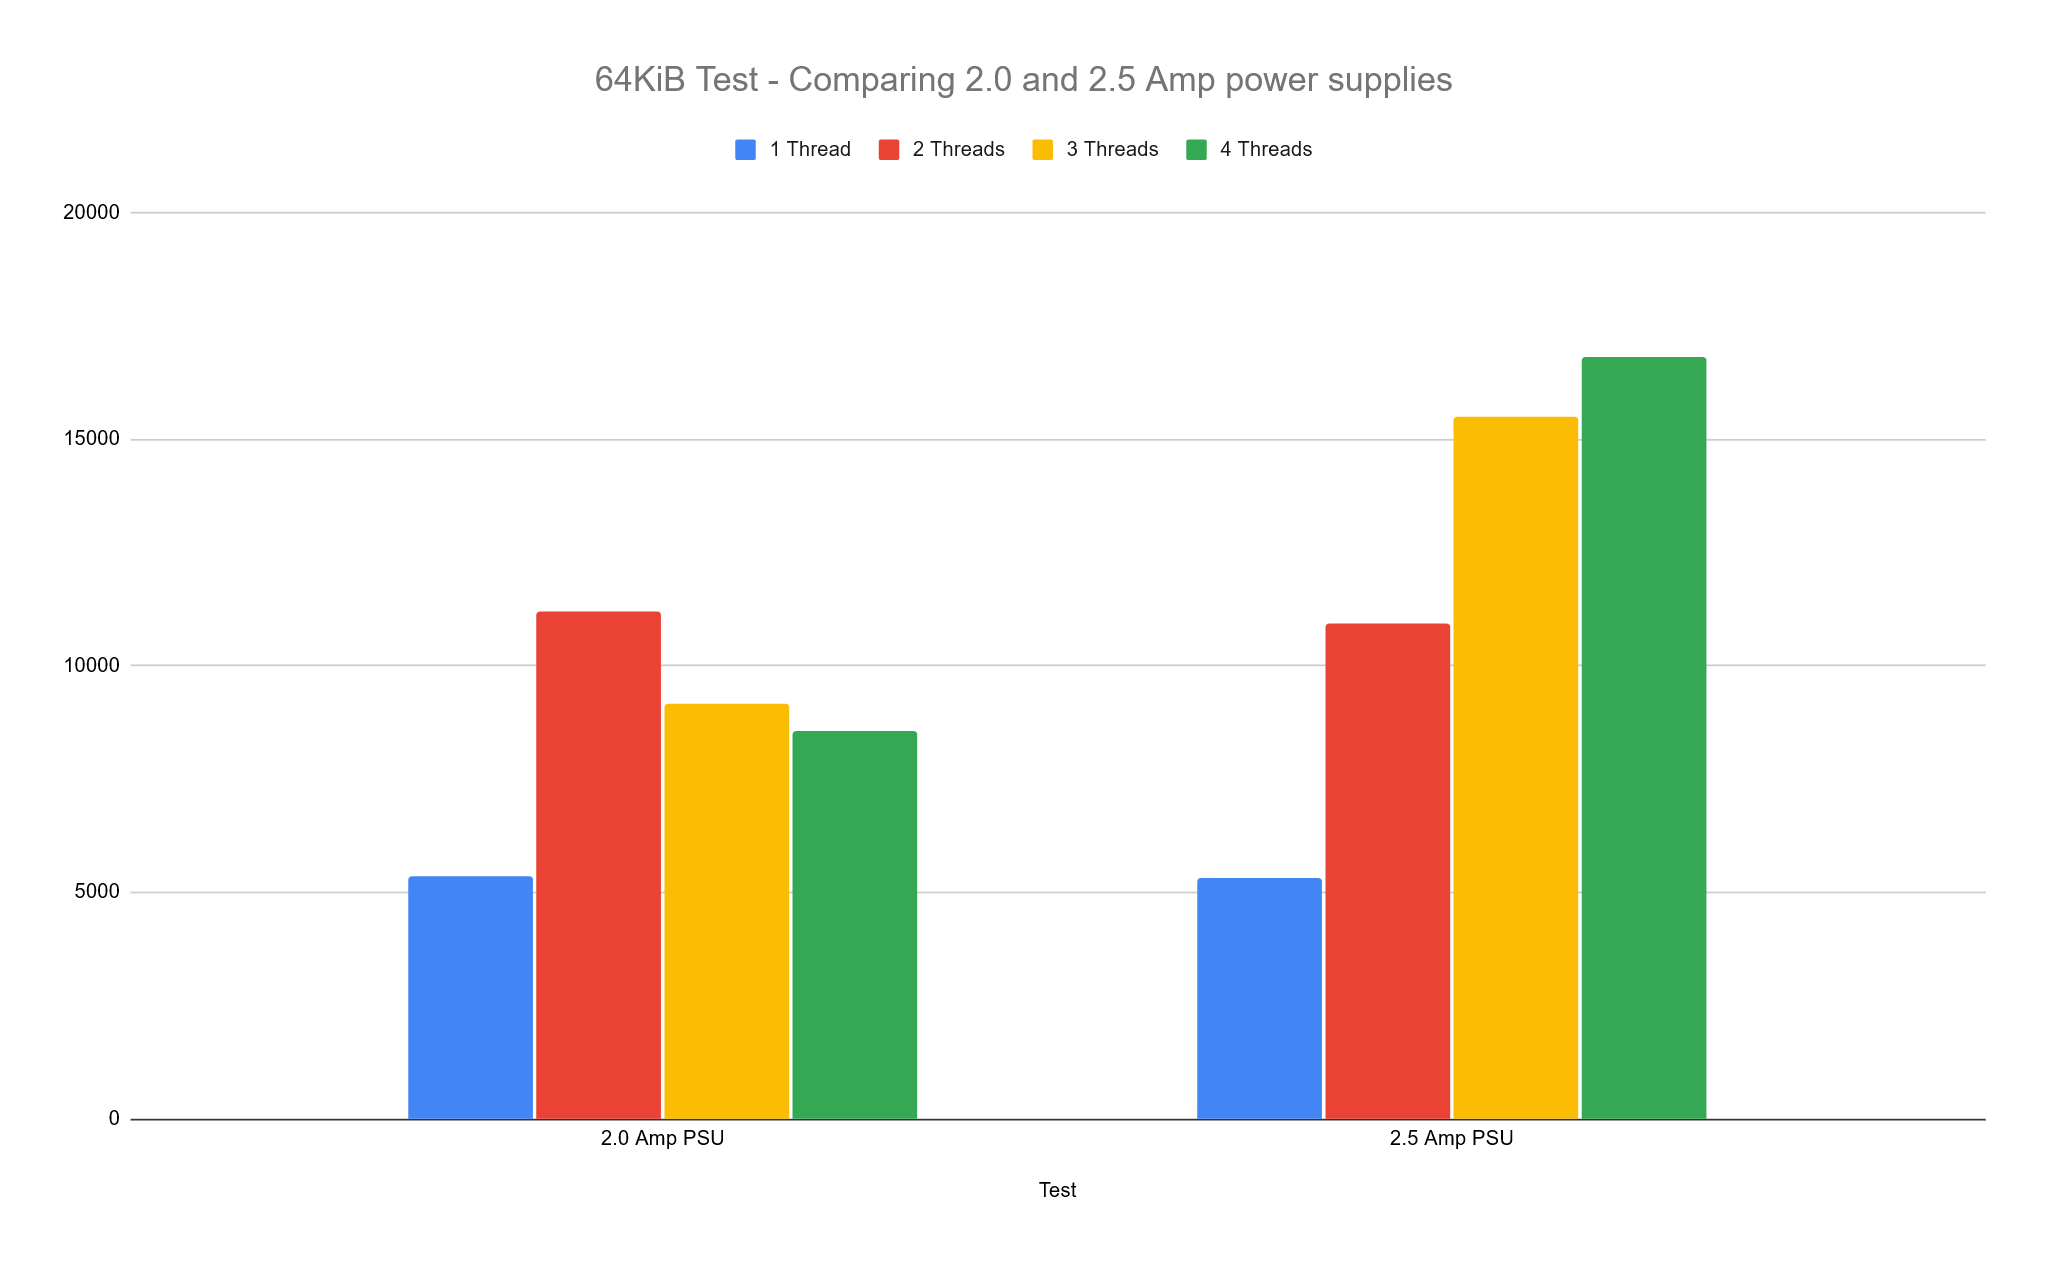
An important problem to watch out for with the Raspberry Pi (and one which I initially fell for) is the the impact of having an insufficient power supply. The Raspberry Pi 3 I’ve used for these benchmark requires at least a 2.5A power supply, but the one I was using was a 2.0A. Initially my results seemed consistent but as I introduced more threads and larger data sizes and the system was under more load, I started to find performance quickly drop off. We can run the command vcgencmd get_throttled to query whether the system is currently throttled or has ever been throttled. The chart below compares the 2.0A and 2.5A power supplies.
Closing Thoughts
I think one of the main takeaways from these tests is that throwing more threads at a problem isn’t always the option. We’ve shown in fact that in certain scenarios, more threads can actually degrade overall performance so the most important thing to do is measure!
Leave a Reply